What are signals in trading — and why do most traders get them completely wrong? Trading signals are specific, data-driven triggers that tell you when to enter or exit a position, based on price action, technical indicators, or market conditions. At Crazii JTVertex, we have spent years watching Australian retail traders lose money not because markets are cruel, but because they misread — or blindly follow — signals without understanding what is actually driving them. This guide on what are signals in trading that actually move markets will walk you through the mechanics, the traps, and the honest picture the data paints. By the end, you will know exactly how to read a signal, when to trust it, and when to walk away.
Important note: This article is general information only and does not constitute personal financial advice. Trading CFDs, forex, and other leveraged products carries significant risk of loss. Please consider your own financial circumstances and read all relevant Product Disclosure Statements before trading.
Ready to see real trading signals in action?
Crazii JTVertex curates tools and resources built specifically for Australian traders who want clarity before they commit capital.
Explore Crazii JTVertexTable of contents
- 01 What are signals in trading and how do they actually work?
- 02 What types of trading signals move markets the most?
- 03 Why do so many traders misread signals and lose money?
- 04 How do you evaluate whether a trading signal source can be trusted?
- 05 What are the most common mistakes traders make with signals?
- 06 Frequently asked questions about trading signals
What are signals in trading and how do they actually work?
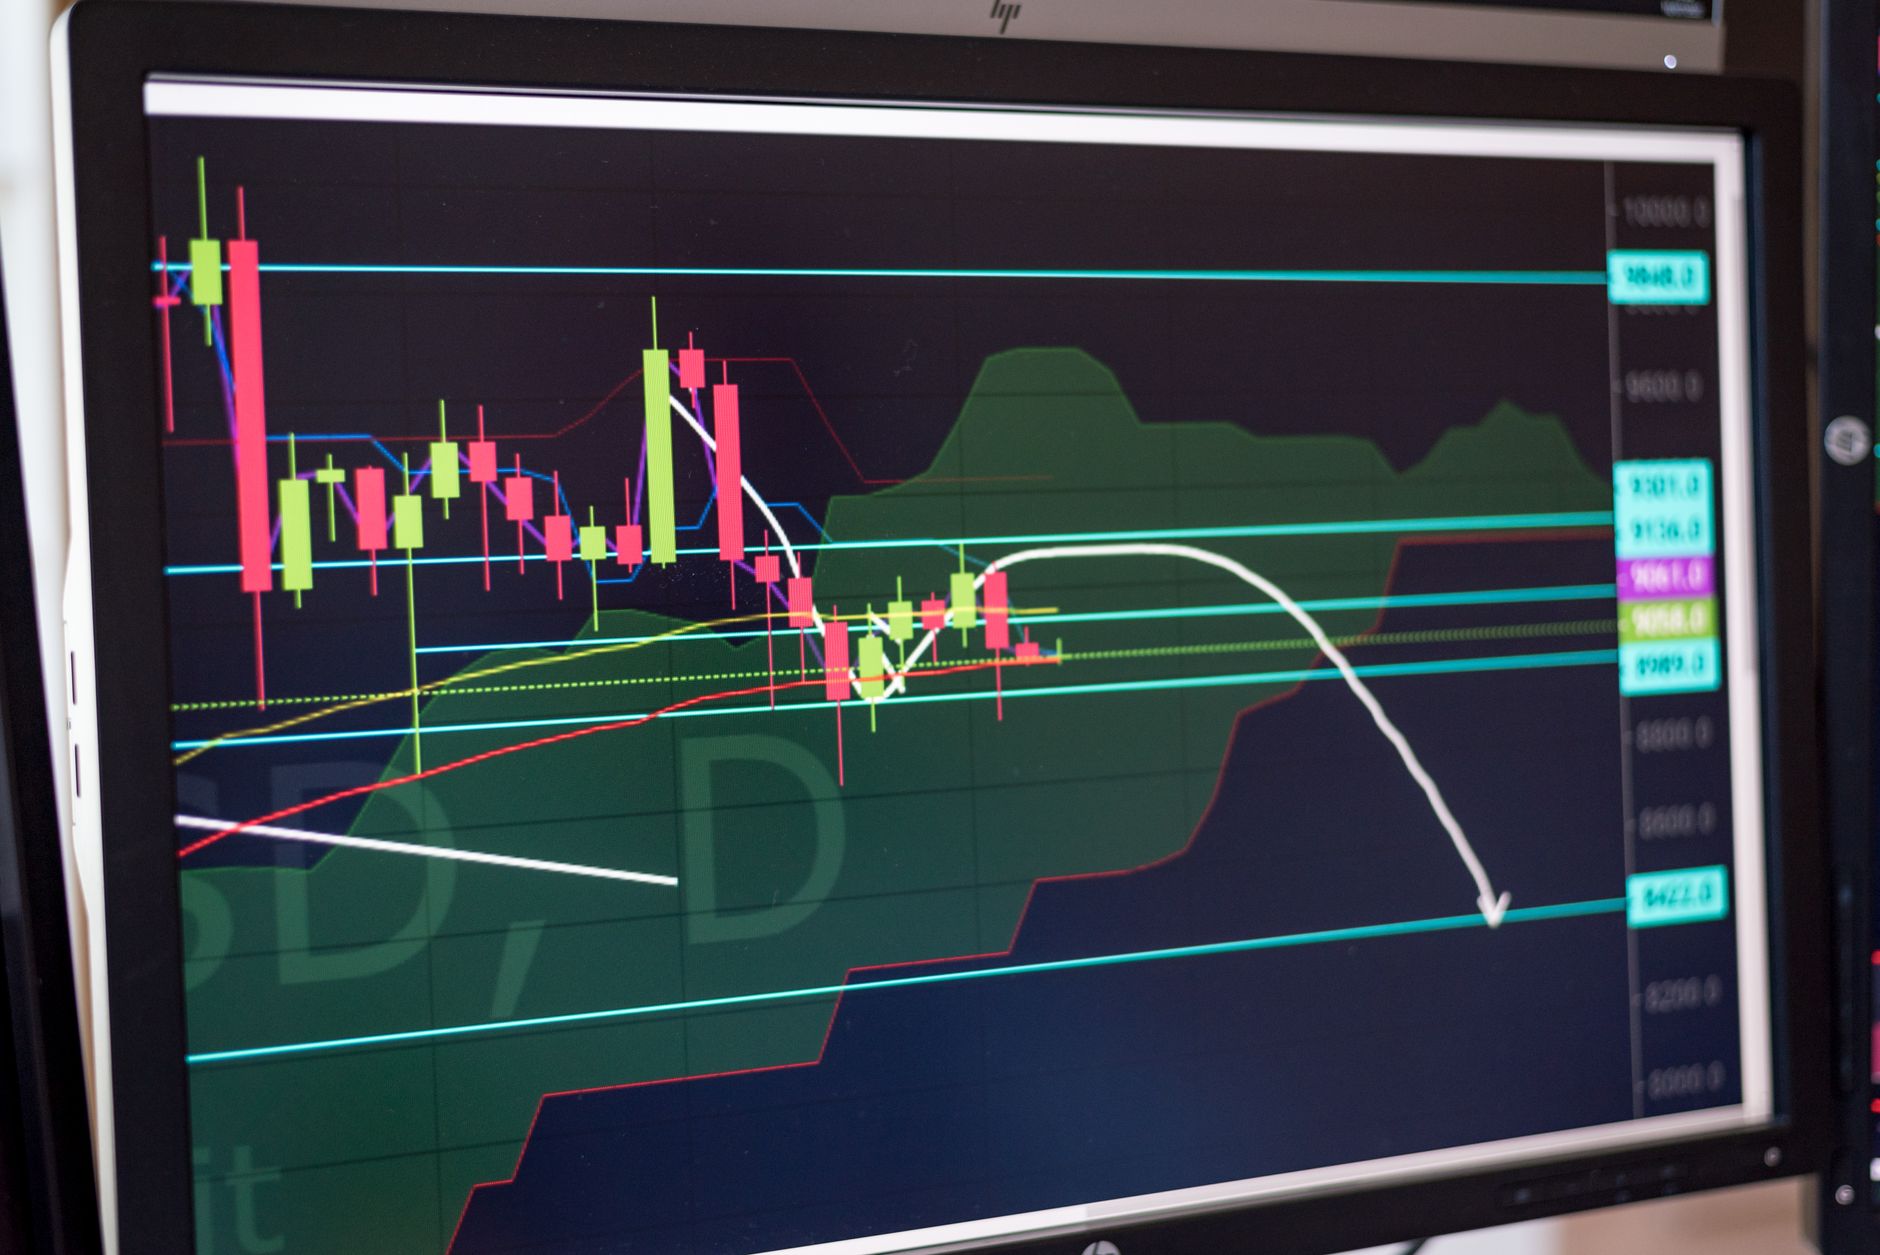
Key points: A trading signal is a data-driven trigger — generated by technical indicators, price patterns, or market conditions — that suggests a specific entry or exit point. Signals do not guarantee profit; they shift probability. Understanding the mechanism behind a signal is what separates informed traders from gamblers.
The evidence: According to ASIC’s Report 828 (published January 2026, covering FY2023–24), 68% of retail CFD clients in Australia lost money — that is more than 133,674 individual traders recording net losses exceeding $458 million in a single financial year. To put that in plain terms: for every three traders following signals and strategies in the Australian market last year, roughly two of them finished the year with less money than they started with.
Expert tip: Crazii JTVertex has reviewed hundreds of signal providers over the years. One pattern that almost never gets discussed publicly: the best-performing signals in back-tests almost always degrade within 90 days of being shared publicly, because once enough traders act on the same signal simultaneously, the market absorbs and neutralises the edge. If a signal has been “working” for years in a public Telegram group with 40,000 members, ask yourself why it is still working.
| Signal Component | What It Tells You | What It Does Not Tell You |
|---|---|---|
| Entry price | Where to open the position | Whether the move will sustain |
| Stop-loss | Maximum acceptable loss per trade | Whether price will respect that level |
| Take-profit | Target exit if the trade works | Whether price will reach that level |
| Direction (buy/sell) | Suggested market bias | Macro or news context driving price |
| Timeframe | Relevant chart period | Higher timeframe trend alignment |
What types of trading signals move markets the most?
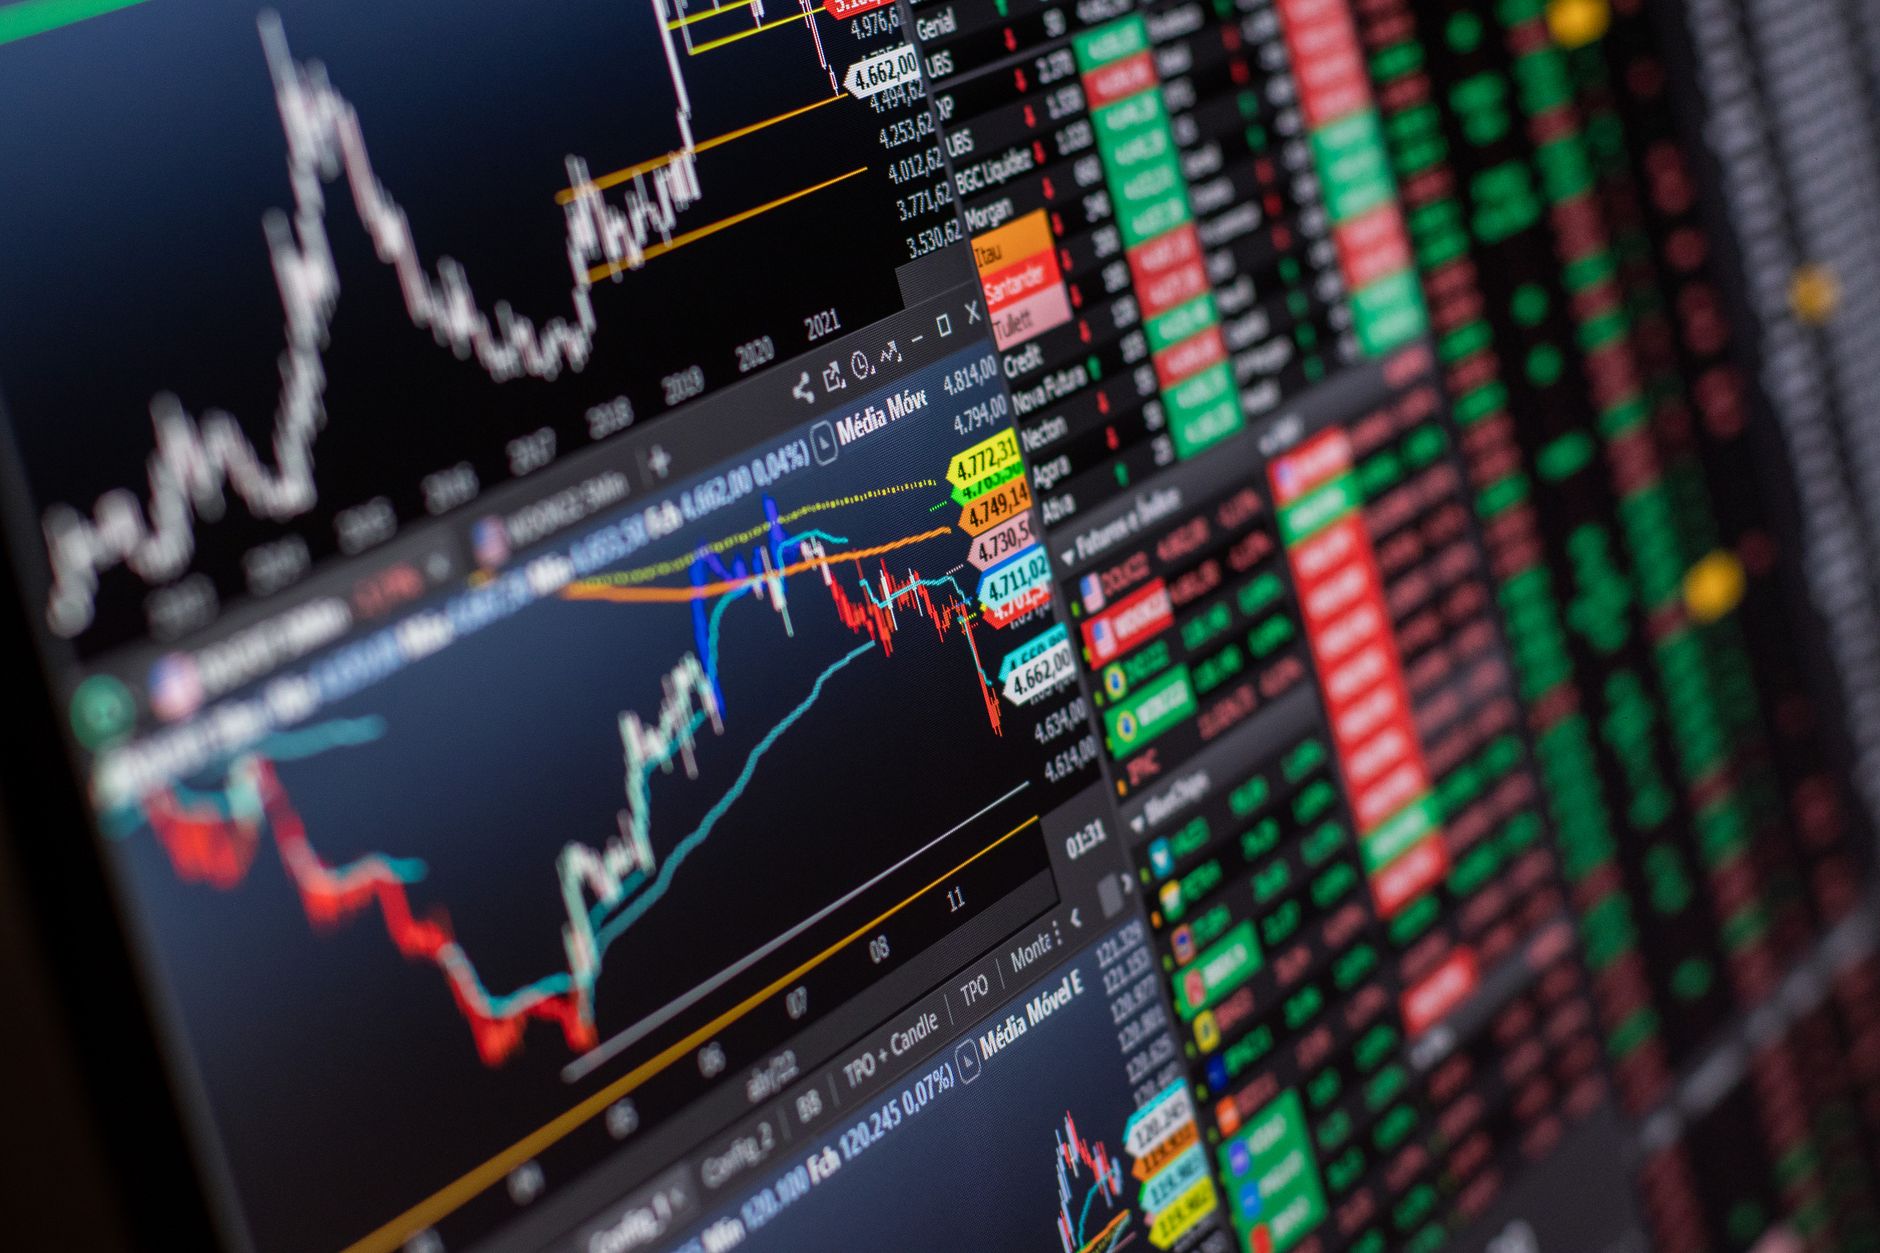
Key points: Trading signals fall into three broad categories — technical, fundamental, and sentiment-based. Each category carries different lag times, reliability windows, and risk profiles. The signals that move markets most dramatically are usually fundamental or sentiment-driven, but technical signals are what most retail traders actually use day-to-day.
The evidence: The MetaTrader platform alone hosts over 3,200 free and commercial signal providers through its built-in marketplace, according to MetaQuotes (MQL5, accessed June 2026). That is 3,200 different approaches to the same market — which tells you something important: there is no single “correct” signal. There are only signals that suit specific market conditions, timeframes, and risk tolerances.
Expert tip: We learned this the hard way during a period of heavy AUD/USD trading. A textbook RSI oversold signal fired on the 4-hour chart — clean setup, confirmed by a support level. Entered the trade. Within 20 minutes, the RBA released commentary that shifted the market 80 pips in the opposite direction. The technical signal was “correct” in isolation. The macro context made it irrelevant. Now, we never enters a position within two hours of a scheduled economic release, regardless of how clean the technical setup looks.
Identify the signal category first
Before acting on any signal, determine whether it is technical, fundamental, or sentiment-based. Each requires a different response framework and has different reliability windows.
Check timeframe alignment
A buy signal on a 15-minute chart that contradicts a strong downtrend on the daily chart is low-probability. Always check the higher timeframe before acting on a lower timeframe signal.
Note upcoming economic events
Check an economic calendar before entering any signal-based trade. Fundamental events can override even the most technically sound setups within minutes.
Want to see which signal tools Crazii JTVertex actually uses?
The Crazii community on Telegram shares real-time signal analysis and context — not just entry points, but the reasoning behind them.
Join the Crazii CommunityWhy do so many traders misread signals and lose money?

Key points: Most retail traders lose money on signals not because signals are inherently unreliable, but because they follow them without understanding the underlying logic, ignore risk management, or overtrade. ASIC data shows that trading frequency itself is a significant predictor of loss after fees.
The evidence: ASIC’s FY2023–24 data also shows that 5% of all retail CFD clients would have made a net profit based on their trading outcomes alone, but ended up in a loss position solely because of fees. That is one in twenty traders who had the right instincts, executed reasonably well, and still lost money — because fees are a structural headwind that compounds with every trade you place.
Expert tip: Crazii JTVertex tracks every signal followed over a minimum of 100 trades before drawing any conclusions about its validity. This is a personal heuristic, not a statistical standard — but it exists because anything under 100 trades is too small a sample to distinguish skill from luck. If a signals provider cannot show you at least 100 verified historical trades, treat their track record as unproven.
Learn to read signals before risking real capital
Crazii JTVertex points Australian traders toward tools and platforms that build genuine signal literacy — starting with the right foundations.
See the 2026 Signal Tools GuideHow do you evaluate whether a trading signal source can be trusted?
Key points: A trustworthy signal source shows verified trade history across at least 100 trades, discloses drawdown clearly, does not promise guaranteed returns, and explains the logic behind each signal. Opacity is a red flag. Any provider who cannot or will not show you their historical performance in detail is not worth your capital.
The evidence: ASIC Report 828 (January 2026) noted that 26,243 retail clients in Australia used copy trading services in FY2023–24 — a figure ASIC described as reflecting “a growing interest in copy trading.” But that same report documented that 68% of all retail CFD clients lost money overall. Copy trading and signal-following are not inherently safer than independent trading; they carry the same structural risks.
Expert tip: We once spent three months following a provider with an impressive-looking equity curve. The curve showed steady growth with minimal drawdown. What it did not show — and what we only discovered by reading the fine print — was that the provider used extremely wide stop-losses that were rarely hit, making the drawdown look small while the actual risk per trade was enormous. The equity curve looked smooth because losses were being deferred, not avoided. Always ask: what is the maximum stop-loss on each trade, not just the overall drawdown percentage.
| What to Look For | Green Flag | Red Flag |
|---|---|---|
| Trade history | Verified 100+ trades, win/loss shown | Screenshots only, no verified data |
| Drawdown disclosure | Maximum drawdown clearly stated | Only winning periods highlighted |
| Risk language | Risk acknowledged on every signal | “Guaranteed” or “risk-free” claims |
| Business model | Subscription fee, no trade incentive | Commission per trade placed |
| Signal logic | Explains what generated the signal | Just “buy” or “sell” with no context |

What are the most common mistakes traders make with signals?

Key points: The three most damaging mistakes with trading signals are following signals without understanding the logic, ignoring fees as a structural cost, and overtrading in response to signal volume. Each of these mistakes compounds the others — and all three are documented in Australian retail trading data.
ASIC Report 828 (January 2026) found that $73 million of the $458 million in net retail losses in FY2023–24 came from fees alone. That is not a rounding error — it is a structural drag that compounds with every trade. Traders who follow high-frequency signal providers are particularly exposed, because more trades mean more fees, regardless of whether each individual trade is profitable.
ASIC Report 828 specifically noted that 74% of retail clients acquired through paid online advertising lost money in FY2023–24 — worse than the already-high sector average of 68%. If you found your signals provider through a sponsored post, a YouTube ad, or a promoted Instagram account, the data suggests you are starting at a statistical disadvantage before you have even placed a trade.
A signal tells you direction, entry, stop, and target. It does not tell you how much to risk. Traders who follow signals without a consistent position-sizing framework — risking 5% on one trade and 0.5% on the next based on gut feel — will have wildly inconsistent results even if the signals themselves are sound. Risk per trade should be determined before you look at the signal, not after.
Frequently asked questions about trading signals
Key points: These are the questions Australian traders ask most often about trading signals — answered directly, without the marketing language that surrounds most signal providers. No guaranteed outcomes, no hype. Just the honest mechanics.
What are signals in trading and are they legal in Australia?
Trading signals are data-driven triggers that suggest entry or exit points in a market. They are legal in Australia. However, providers who offer signals as part of a managed service or who give personalised financial advice may require an Australian Financial Services Licence (AFSL). Always check whether a provider is ASIC-regulated before subscribing.
Can trading signals guarantee a profit?
No. Trading signals are probabilistic tools, not guarantees. Any provider claiming guaranteed returns is making a statement that contradicts how financial markets work and is inconsistent with ASIC’s regulatory standards. Risk of loss is always present in leveraged trading products.
How many trades should I evaluate before trusting a signal source?
In Crazii JTVertex’s view — as a personal heuristic, not a statistical standard — fewer than 100 verified trades is too small a sample to draw reliable conclusions. A track record covering different market conditions (trending, ranging, high-volatility periods) is more meaningful than raw win rate alone.
What is the difference between a trading signal and copy trading?
A trading signal gives you information to act on yourself — you decide whether and how to trade. Copy trading automatically replicates another trader’s positions in your account. ASIC Report 828 noted 26,243 Australian retail clients used copy trading in FY2023–24, but copy trading carries the same loss risk as independent trading.
Why do signals that work in back-tests often fail in live trading?
Back-tests use historical data and cannot account for real-world factors: slippage, changing market conditions, the impact of many traders acting on the same signal simultaneously, and fees. A signal that appears profitable in back-testing may degrade quickly once deployed in live markets, particularly if it becomes widely known.
Want to talk through your signal strategy with someone who has actually used these tools?
Crazii JTVertex offers direct support for Australian traders building their first real framework — reach out through the contact page or join the community on Telegram.
Get in Touch
Leave a Reply