Category: Understanding Trading Signals

  • Best Trading Signals in the World Ranked for Aussie Traders 2026

    Best Trading Signals in the World Ranked for Aussie Traders 2026

    The best trading signals in the world are not the ones with the flashiest dashboards or the loudest Telegram channels — they are the ones that consistently give you an edge without blowing up your account in the process. At Crazii JTVertex, we have spent years working directly with Australian retail traders, and one truth keeps surfacing: most traders lose not because the market is against them, but because they are using the wrong signals for the wrong reasons. In this guide, you will find a ranked, honest breakdown of the world’s top trading signal sources — built specifically for the Australian market in 2026. By the end, you will know exactly which signal type fits your situation, which ones to avoid, and how to use them without becoming part of the 68% who lose money every year.

    Note: This article contains general information only and does not constitute personal financial advice. Trading CFDs, forex, and other leveraged products carries significant risk. Please consider your own financial circumstances and review all relevant disclosure documents before acting on any information here.

    Not sure where to start with trading signals?

    Join the Crazii JTVertex community and get direct access to signal discussions, tool breakdowns, and trader support — no fluff, no pressure.

    Join the Group
    Table of contents

    What makes the best trading signals in the world actually work?

    What makes the best trading signals in the world actually work?
    💡

    Key points: The best trading signals in the world share three non-negotiable traits: a verified track record across at least 100 live trades, transparent risk parameters (entry, stop-loss, take-profit), and a signal logic you can understand and replicate — not just follow blindly.

    Let’s be honest about something most signal providers will never tell you. A signal is only as good as the context around it. You can receive the most accurate entry point in the world at 2:47 AM Sydney time, but if you are half-asleep, overleveraged, and have no idea what the stop-loss means — that signal is going to cost you money. The mechanics matter less than the framework around them. So what actually separates a world-class signal from the noise? First, reproducibility. The signal must come from a defined, rule-based system — not a gut feel dressed up in technical jargon. When we reviewed dozens of signal services over the years, the ones that survived market volatility all had one thing in common: you could back-test their logic. If a provider cannot explain the rules behind their signals, that is your first red flag. Second, risk definition. Every legitimate signal includes a stop-loss level. Not a suggestion. A level. The entry price alone tells you nothing without knowing how much you stand to lose if the trade goes wrong. Third, drawdown history. A signal service that has returned 40% over six months sounds impressive — until you realise it went through a 35% drawdown to get there. That is the kind of detail that separates traders who last from traders who blow up.

    The evidence: According to ASIC’s Report 828 (published January 2026, covering FY2023–24), 68% of retail CFD clients in Australia lost money — a net loss exceeding $458 million across the sector. That figure includes $73 million in fees alone. Think about that: fees wiped out clients who might otherwise have broken even. The signal you choose is only part of the equation — cost structure matters just as much.

    Here is something worth sitting with. That $458 million loss figure — spread across 133,674 losing clients — works out to roughly $3,400 lost per person on average. Not a catastrophic blow-up. A slow, grinding erosion. The kind that happens when you are following signals without a proper system around them.

    Expert tip: Crazii JTVertex has reviewed signal services where the provider’s equity curve looked beautiful on screenshots but collapsed the moment you accounted for slippage on illiquid pairs. One service we tested showed a 12-pip average spread on GBPJPY during the London open — which ate the entire projected profit on a 20-pip target. Always ask for the raw trade log, not just the summary chart.
    For a broader view of how signals fit into your overall trading toolkit, the best trading signals and tools for Australian traders in 2026 covers the full picture from tools to platforms — worth reading alongside this guide.
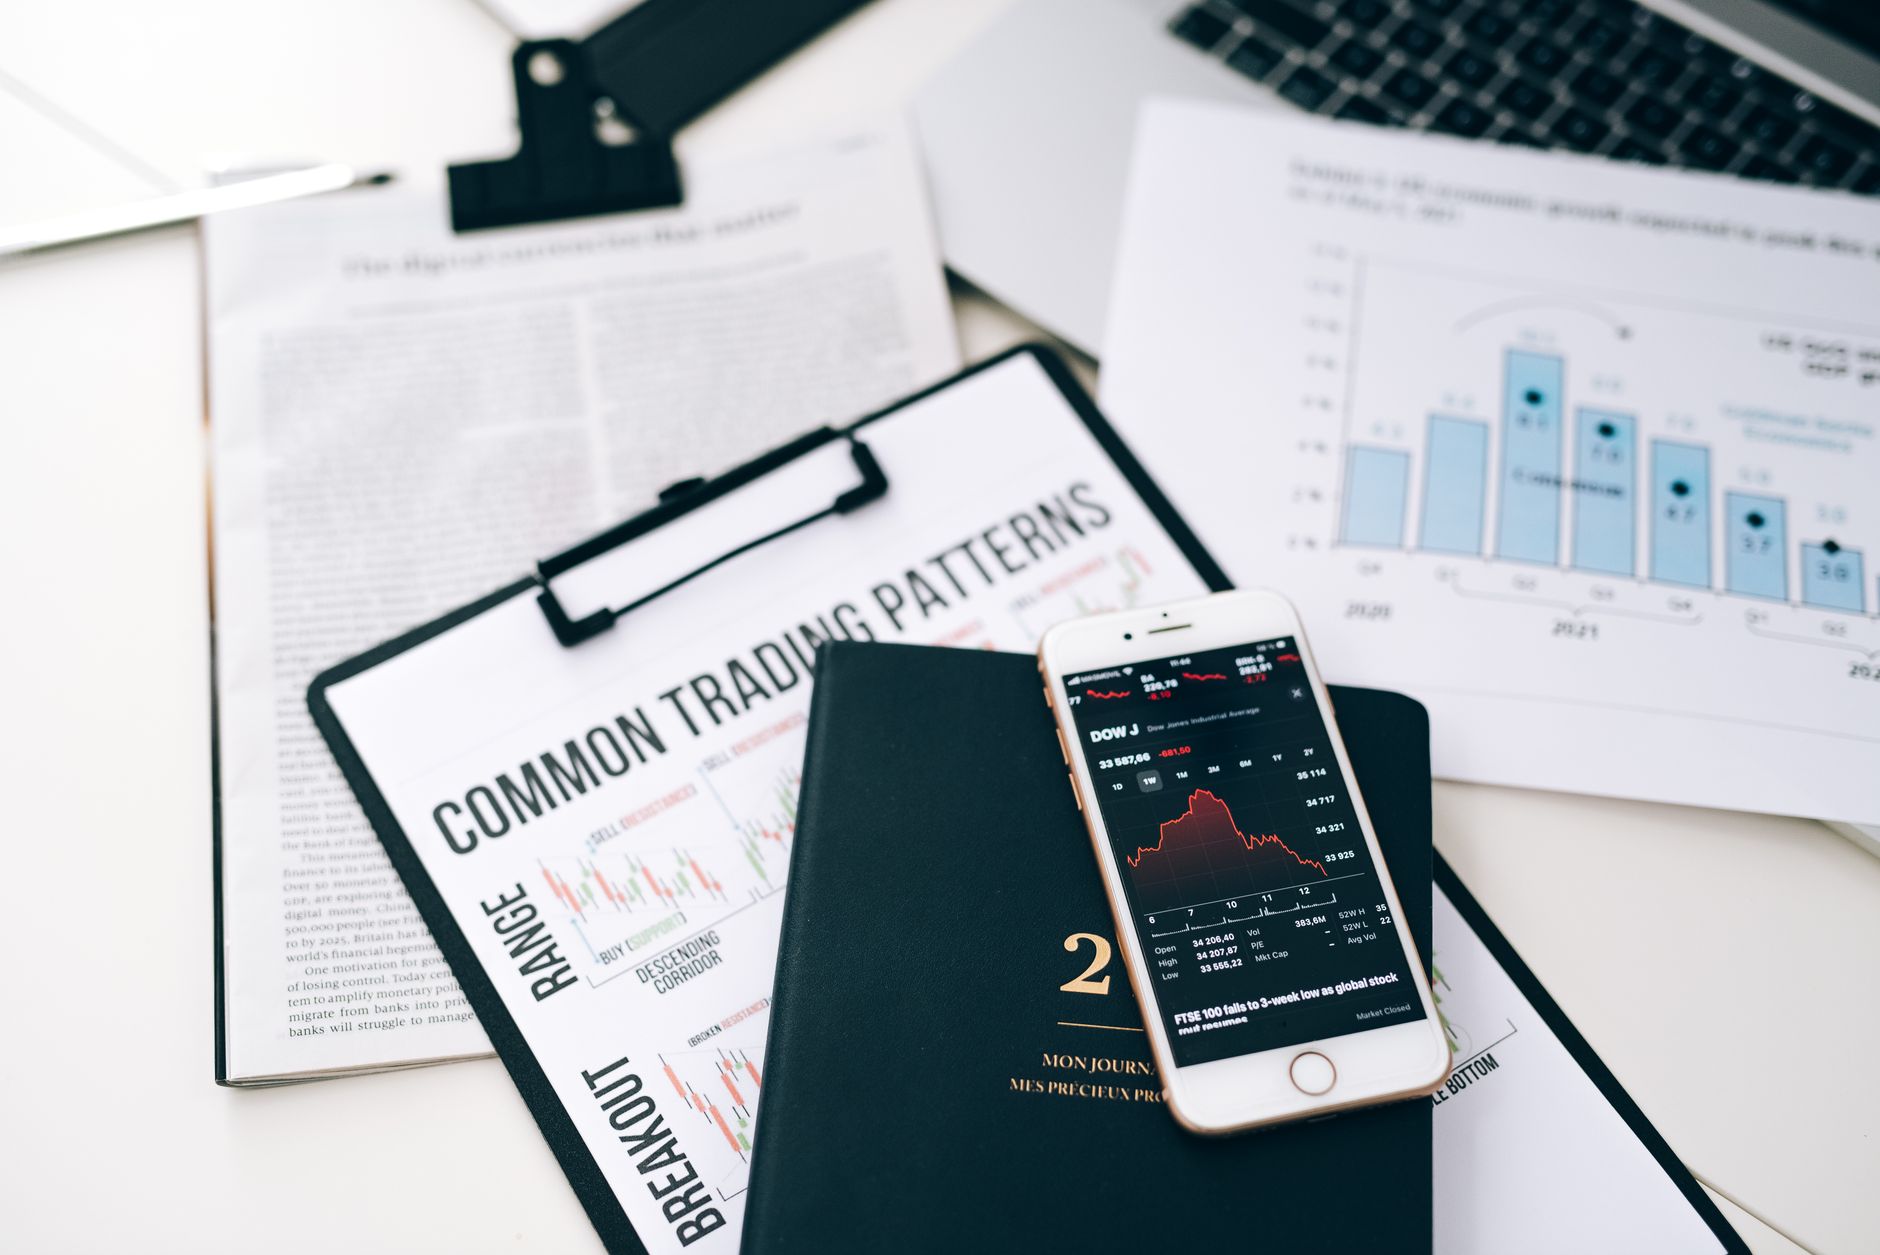
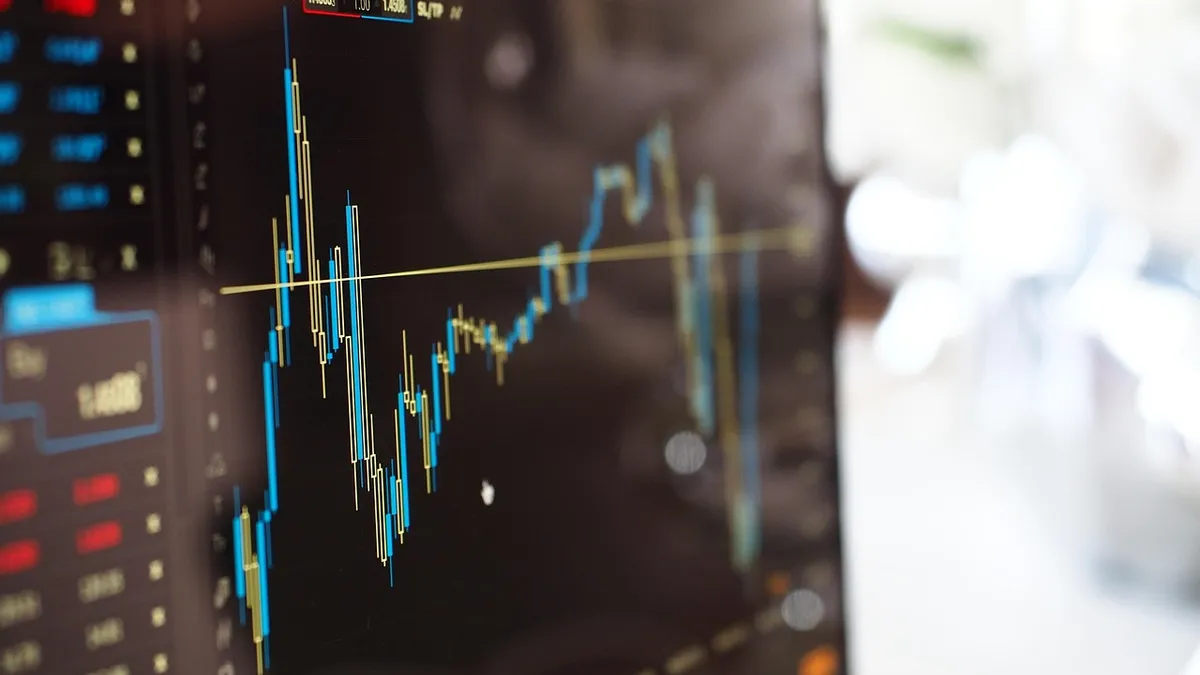
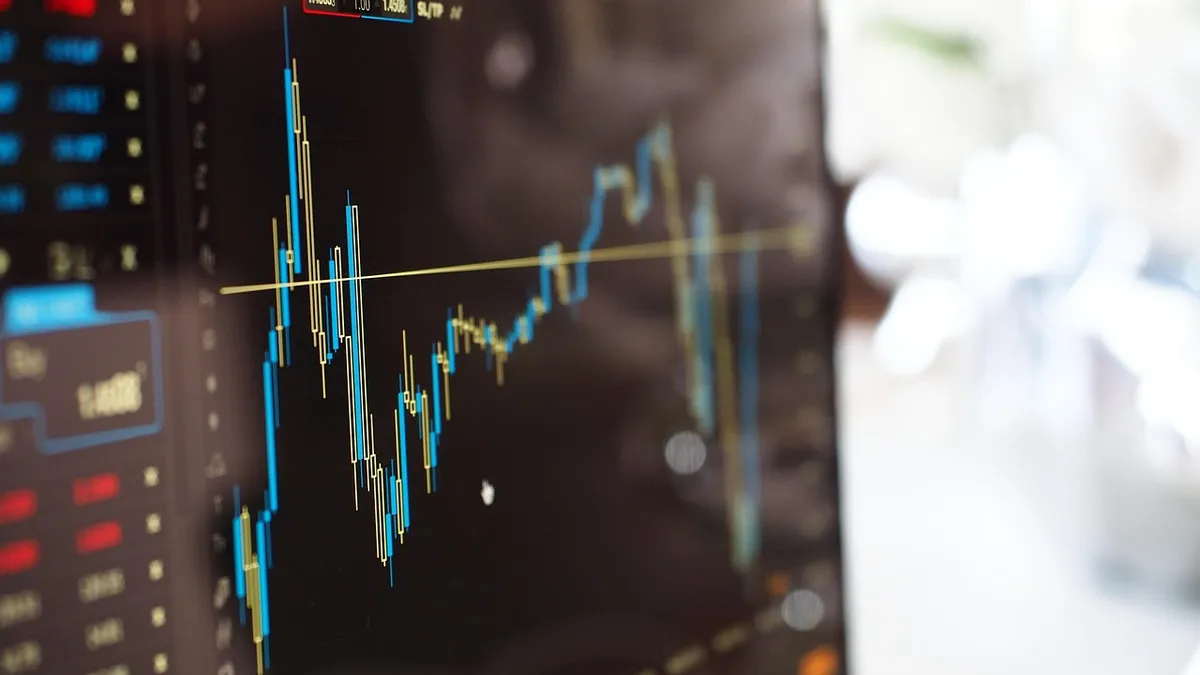
    best trading signals in the world ranked for Australian traders 2026 — Crazii JTVertex
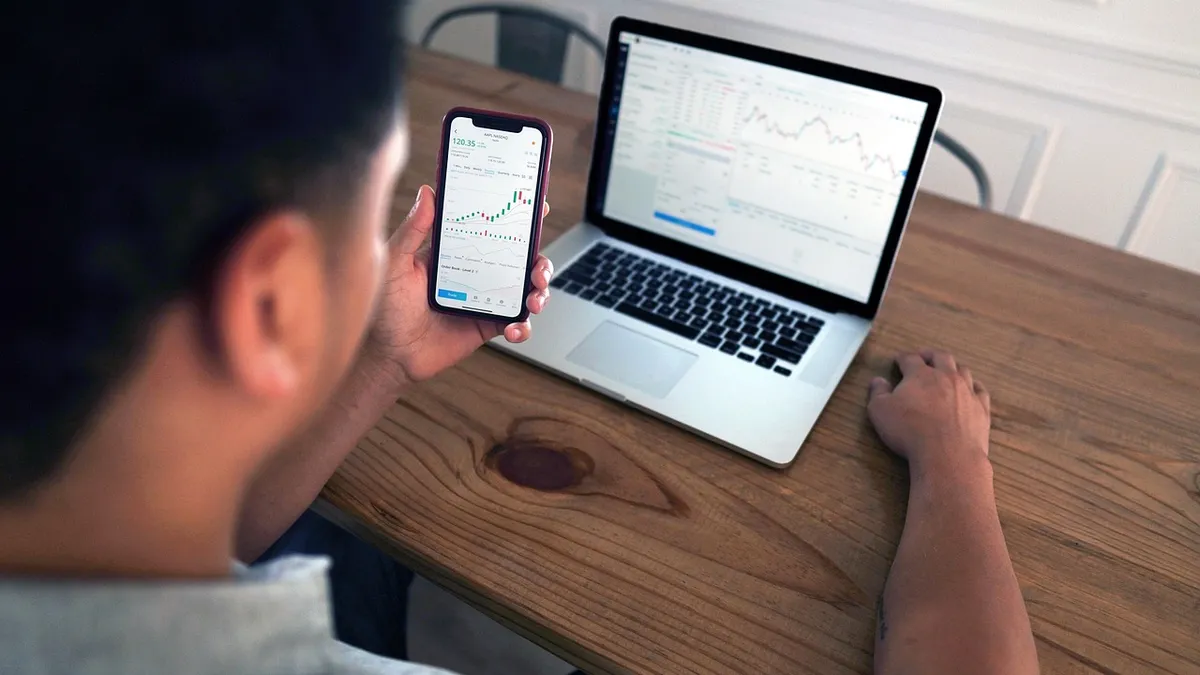
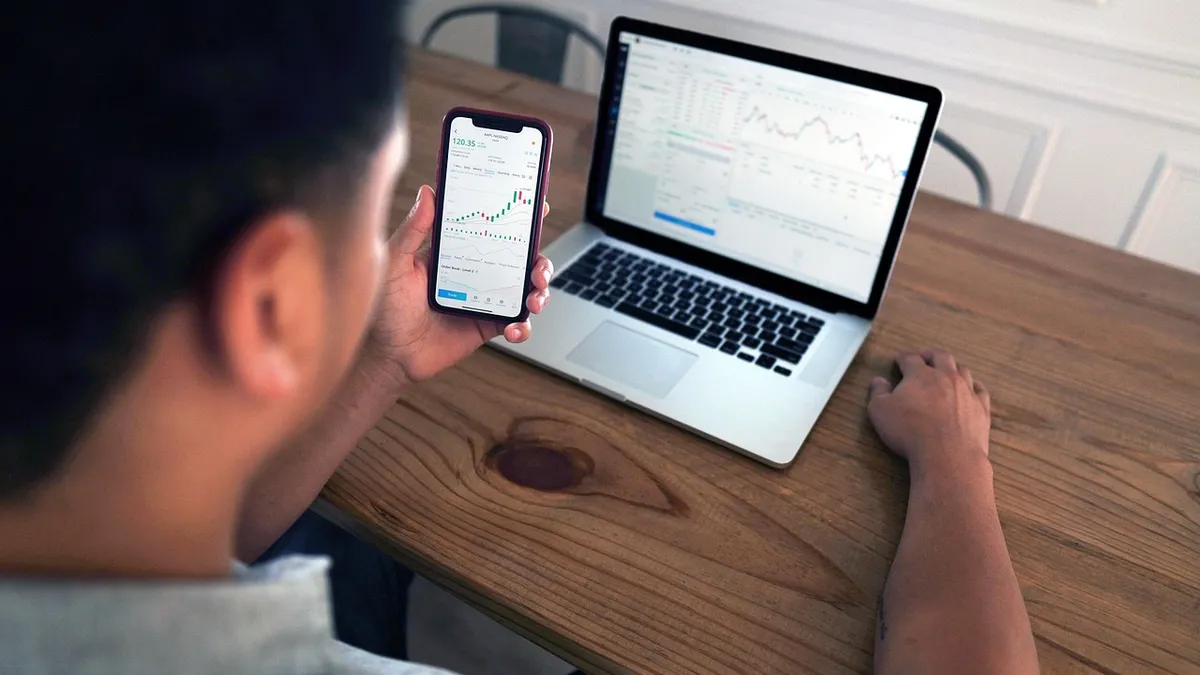
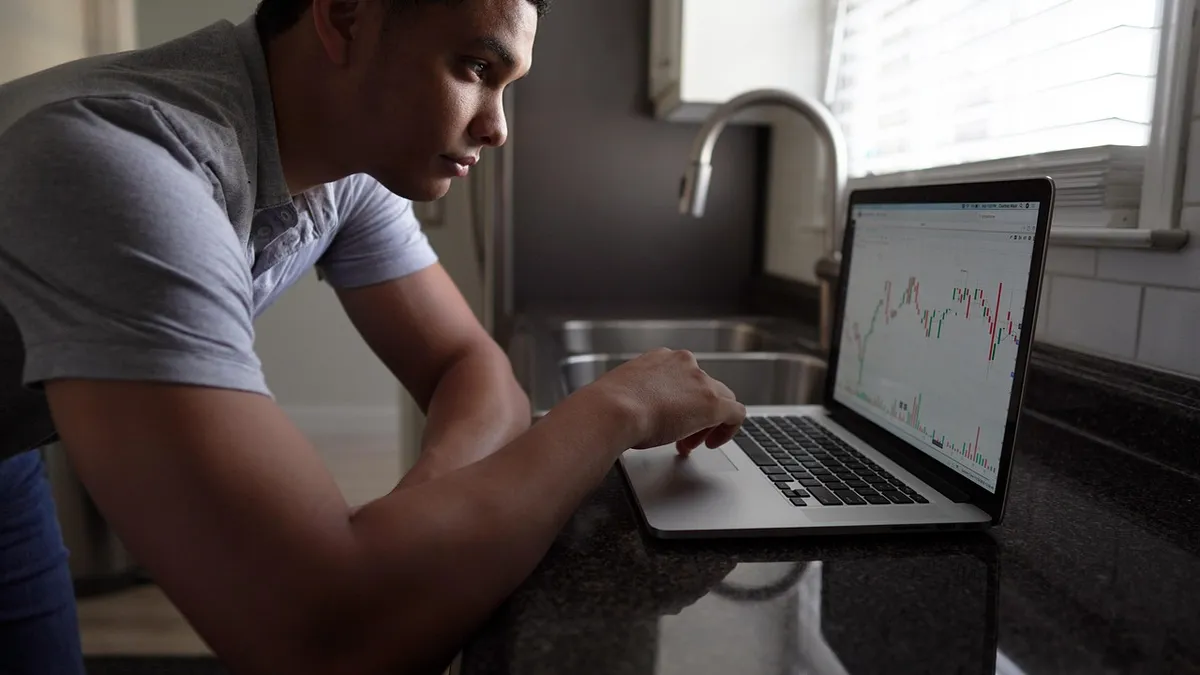
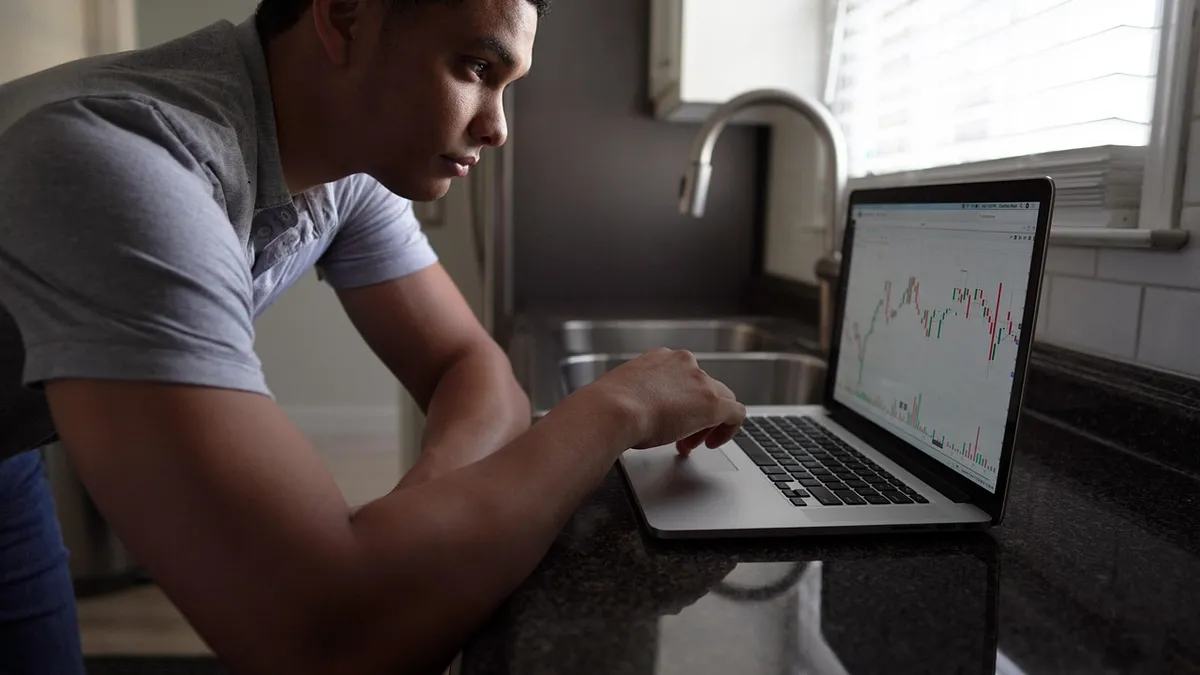
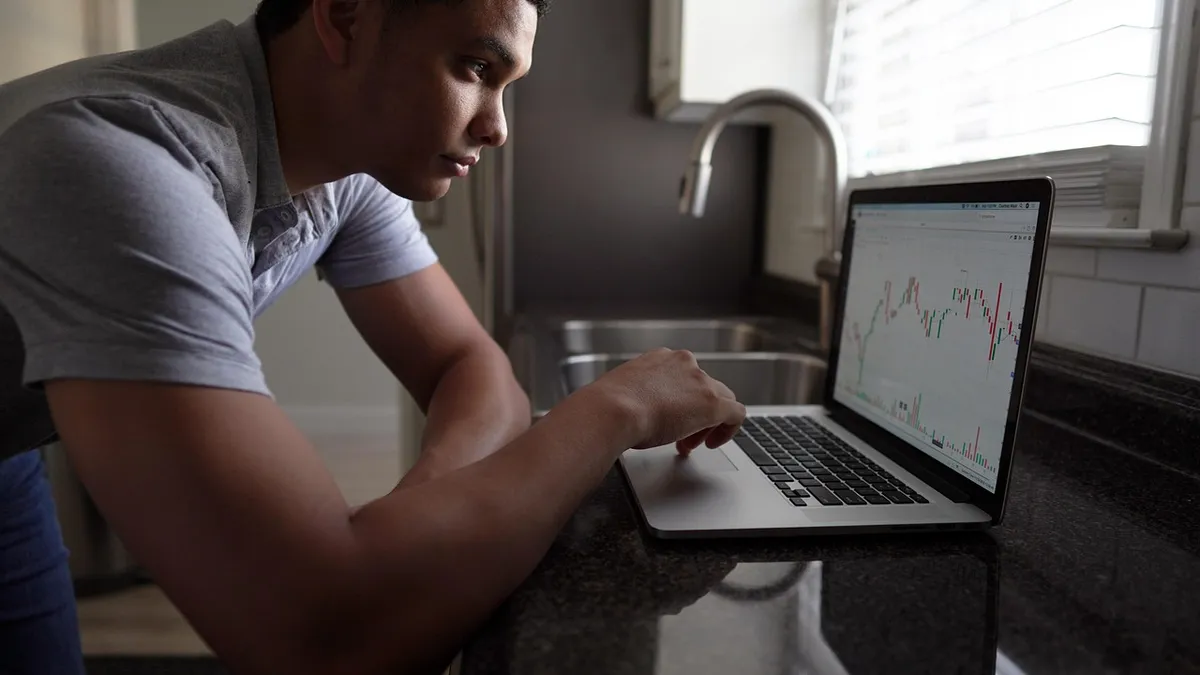
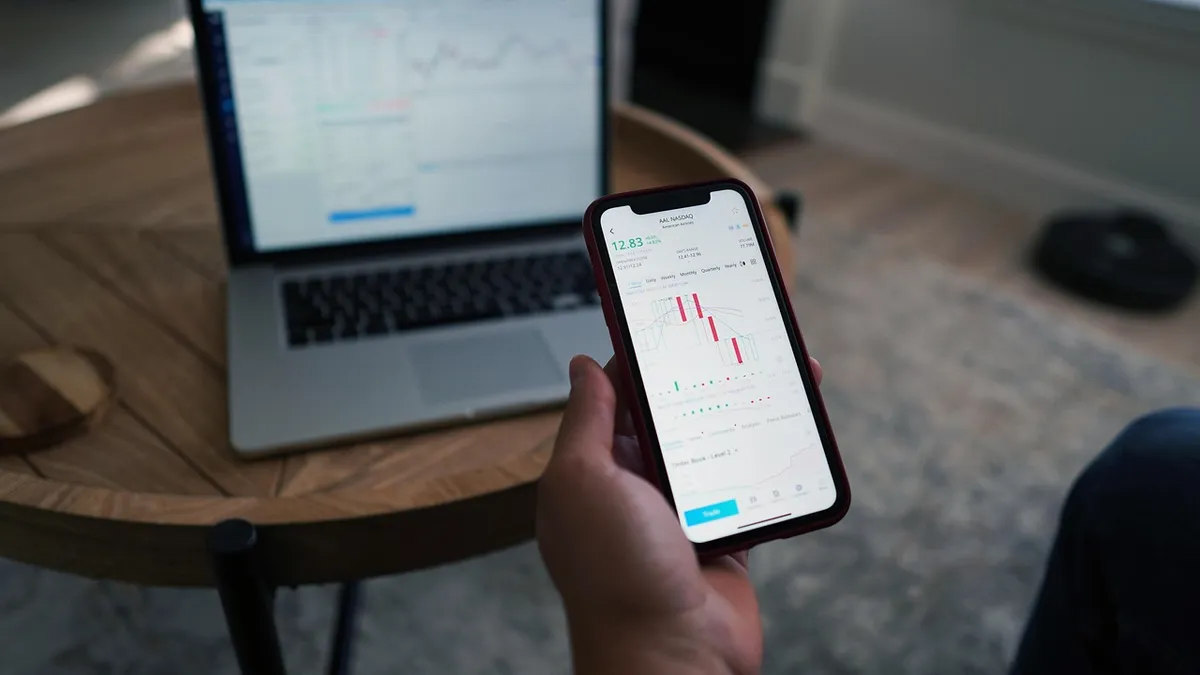
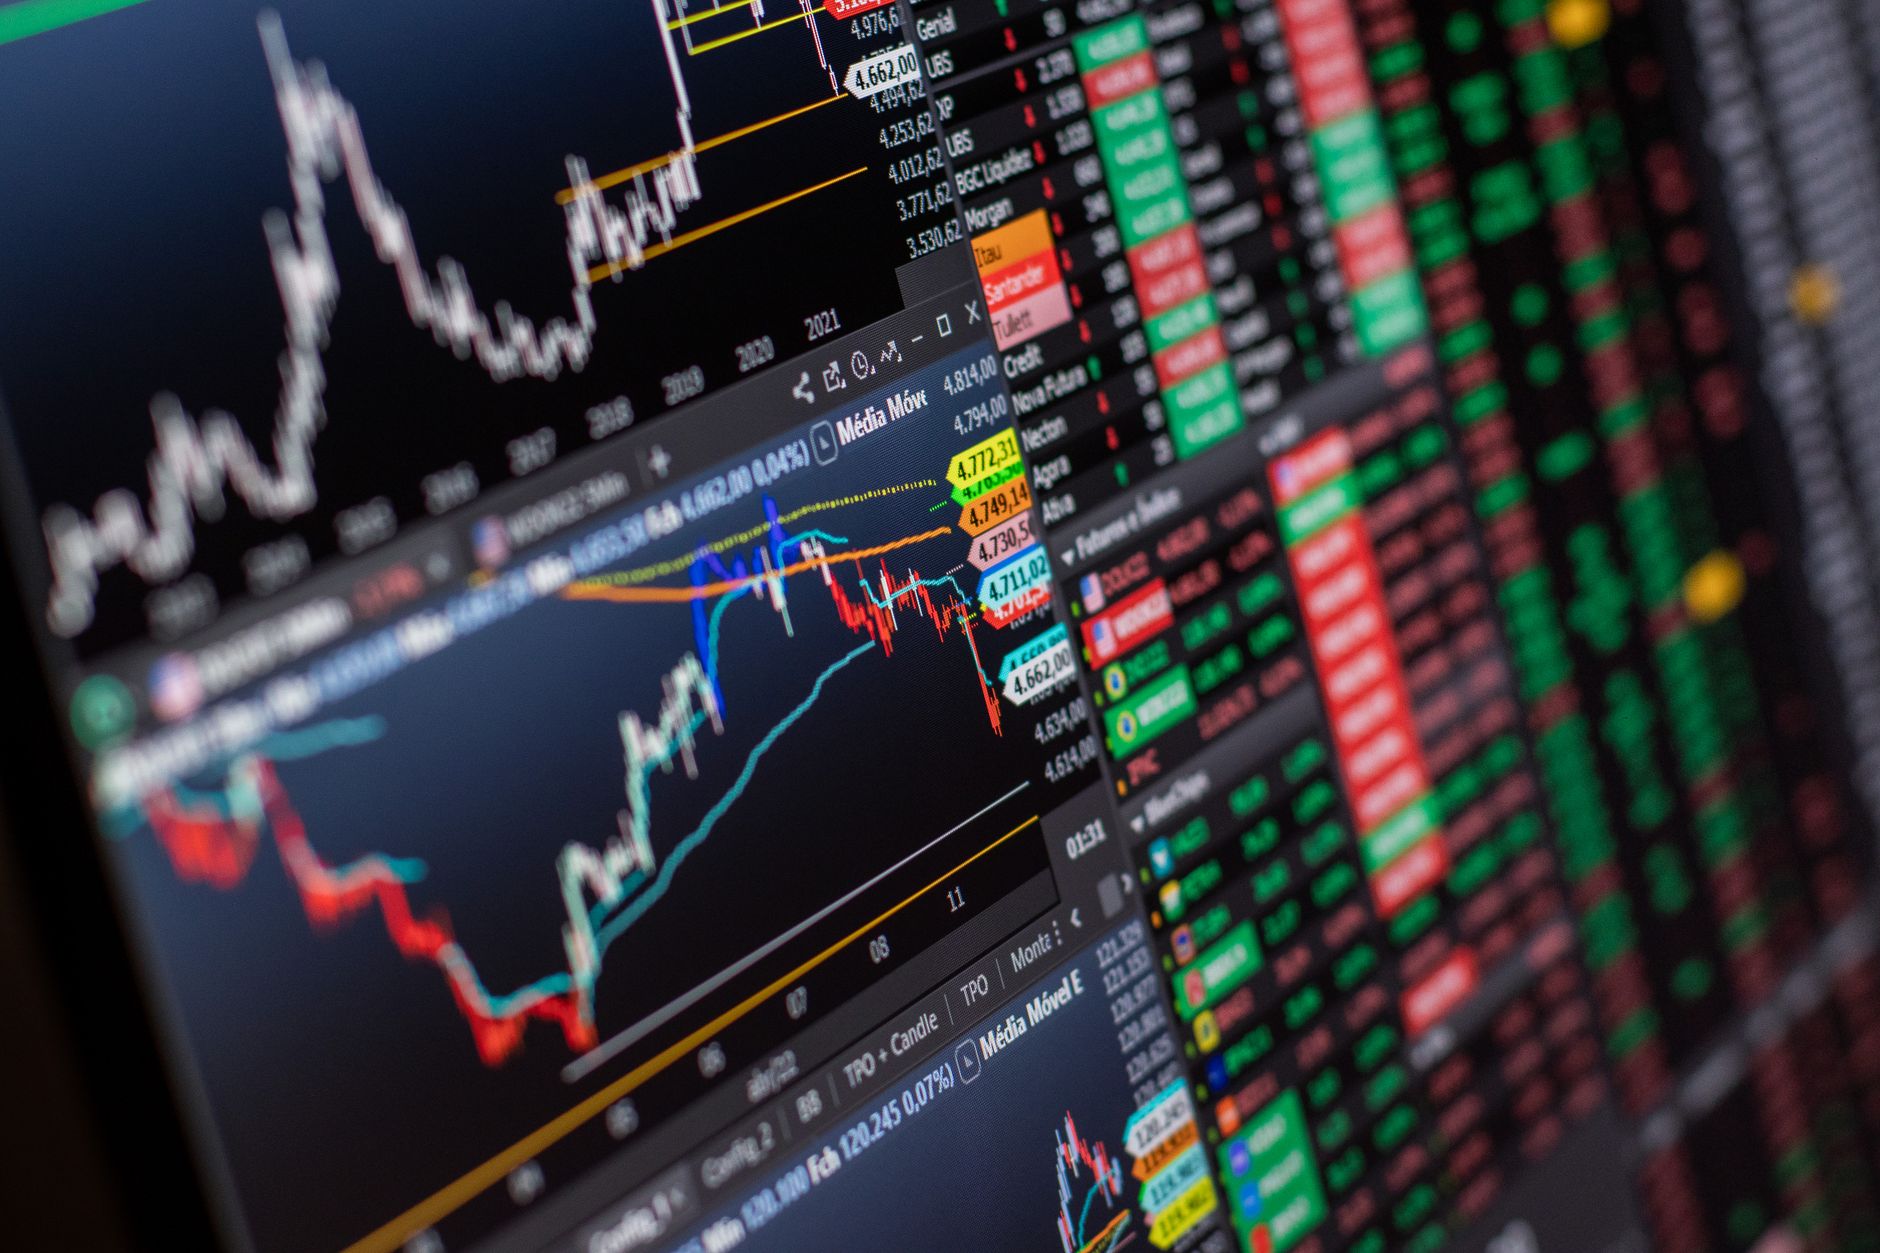
    Understanding what separates world-class trading signals from unreliable sources is the first step for any serious Aussie trader. · Photo: Pexels / Pixabay

    Which trading signal providers rank highest for Australian traders in 2026?

    Which trading signal providers rank highest for Australian traders in 2026?
    💡

    Key points: For Australian traders in 2026, the highest-ranking signal sources combine regulatory transparency, verifiable track records, and compatibility with MT4/MT5 platforms. MetaTrader’s built-in Signals marketplace hosts over 3,200 providers — but fewer than a handful meet the criteria that matter for risk-conscious Aussie traders.

    Meet Jordan. Twenty-nine years old, works in logistics in Brisbane, started trading forex in 2023 with a modest account. Jordan spent the first eight months jumping between three different Telegram signal channels, each promising “high-accuracy calls.” By month nine, Jordan had lost a meaningful portion of the account — not in one dramatic trade, but in a dozen small ones where the signals arrived late, the risk was never defined, and the provider had vanished by the time losses mounted. Jordan’s story is not unusual. It is the default outcome for traders who pick signal providers based on screenshots rather than substance. So which providers actually hold up?

    Want signals backed by a real trading community?

    Crazii JTVertex connects Australian traders with tools, signal discussions, and a platform built for serious learning — not hype.

    Explore Crazii
    MetaQuotes’ MetaTrader Signals marketplace is the most transparent starting point. With over 3,200 signals available directly inside MT4 and MT5, each provider’s live equity curve, drawdown history, and trade-by-trade log is visible before you subscribe. That level of transparency is rare. The catch: most of those 3,200 signals have fewer than 50 trades on record, which is not enough to draw any meaningful conclusions.

    The evidence: ASIC Report 828 recorded 26,243 retail clients using copy trading in FY2023–24, noting “a growing interest” in the space. That is a meaningful number — but it also means the vast majority of Australian retail traders are still selecting signals manually, often without a structured evaluation process.

    Here is how we would rank the main signal categories for Australian traders right now:
    Signal Type Transparency Best For Key Risk ASIC Compatibility
    MT4/MT5 Signals Marketplace High (live track record) Traders on MetaTrader platforms Over-optimised past performance Yes
    Telegram Signal Channels Low (screenshots only) Beginners exploring ideas No verifiable track record Unregulated
    Broker-Integrated Copy Trading Medium–High Hands-off traders Fees eroding profits Depends on broker
    Algorithmic Signal Services Medium Systematic traders Black-box logic, hard to audit Varies
    Manual Analyst Signals Low–Medium Traders wanting market context Subjective, inconsistent timing Varies

    Expert tip: When we evaluates a signal provider on the MT5 marketplace, the first number checked is not win rate — it is the ratio of average win to average loss. A service with a 45% win rate but a 2.1 reward-to-risk ratio is far more sustainable than one with a 70% win rate and a 0.6 reward-to-risk. Most traders look at the wrong column first.
    If you are researching signals delivered via social platforms, the guide on best trading signals on Telegram that delivered results in 2025 goes deep on what actually worked — and what looked good but didn’t.
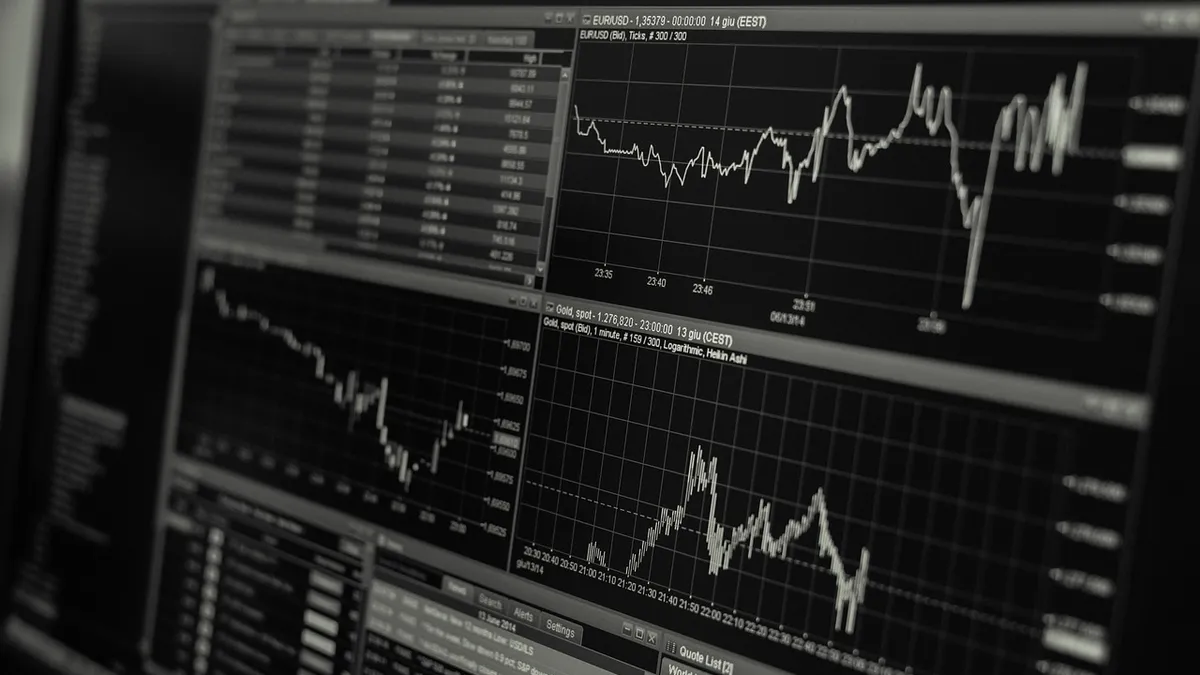
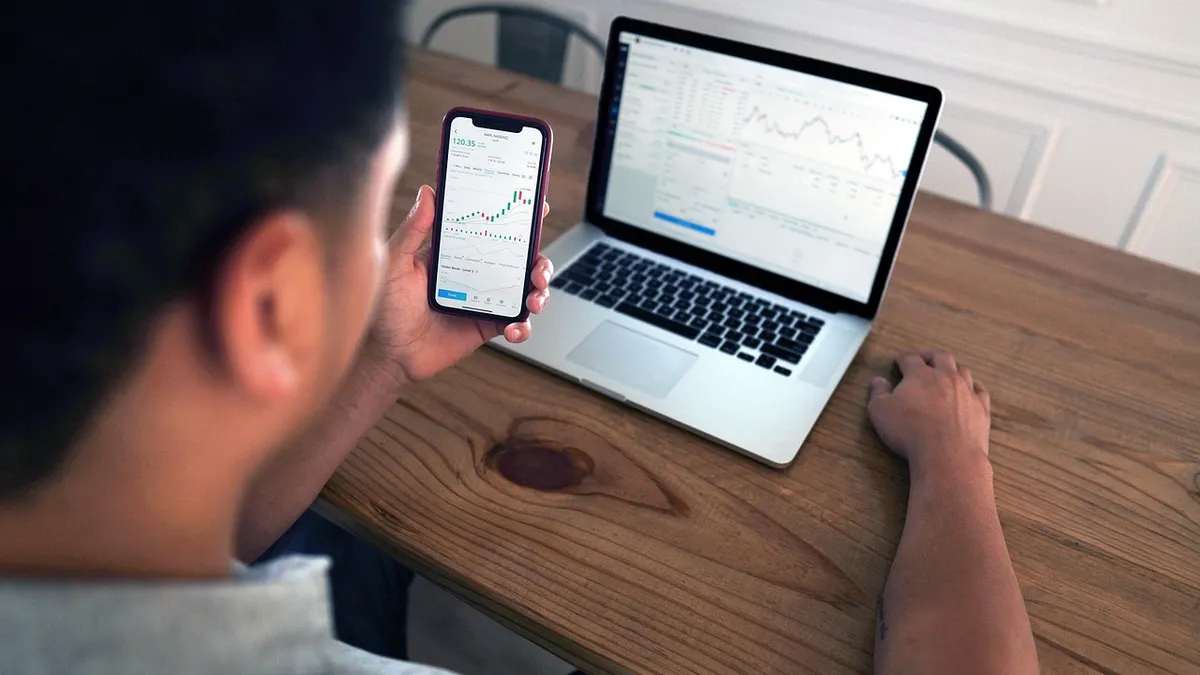
    top-ranked trading signal providers comparison for Australian traders — Crazii JTVertex
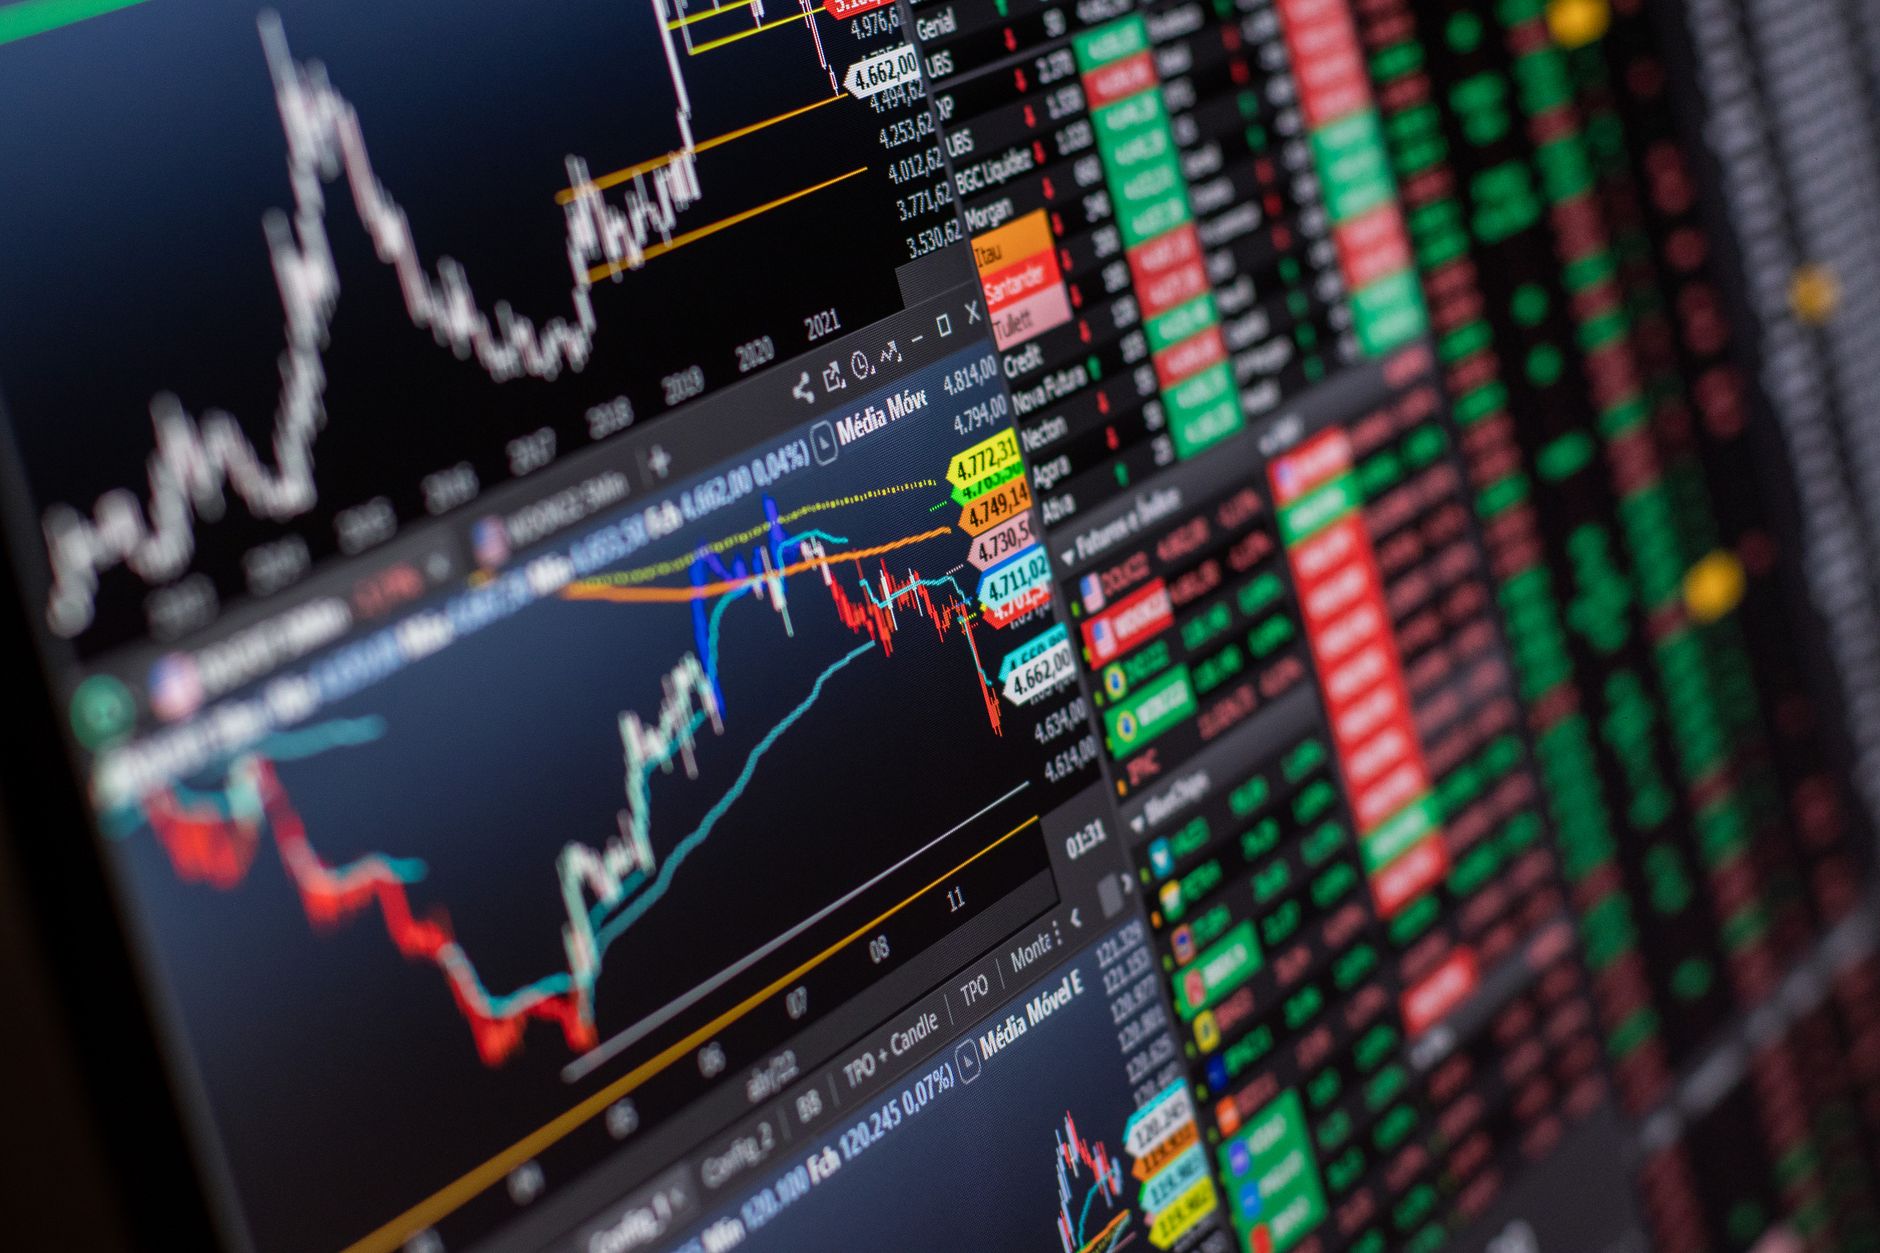
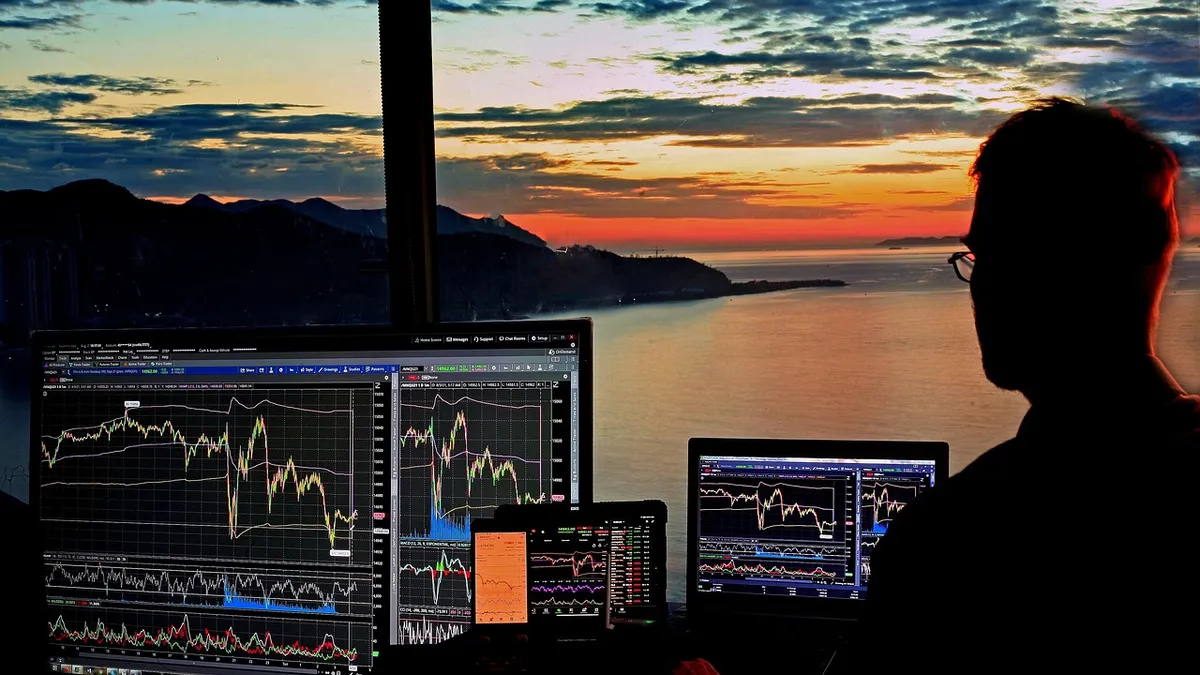
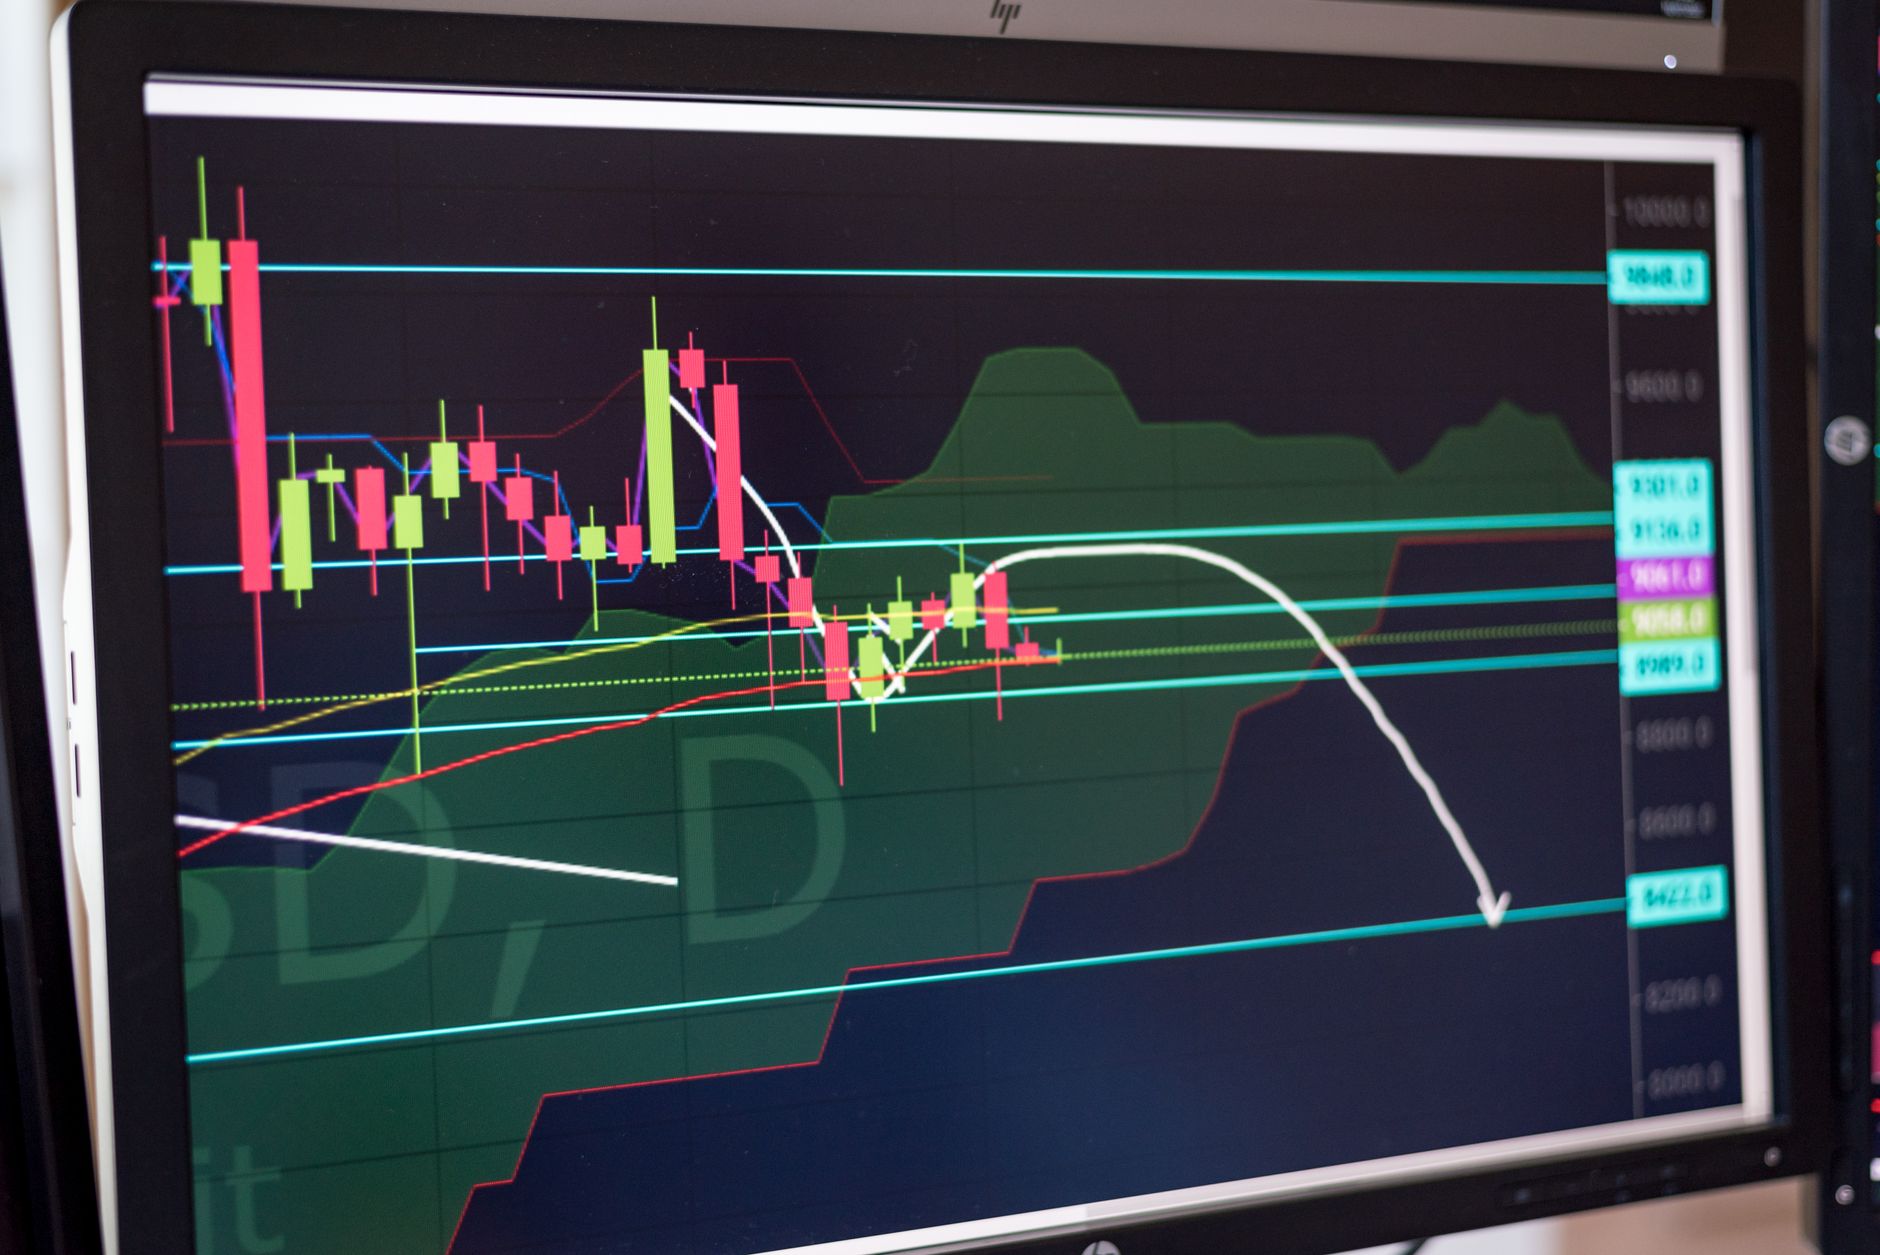
    Comparing signal provider types helps Aussie traders choose the right source based on transparency and risk profile. · Photo: TheInvestorPost / Pixabay

    What are the biggest mistakes traders make when using forex and CFD signals?
    What are the biggest mistakes traders make when using forex and CFD signals?
    💡

    Key points: The three most damaging mistakes with trading signals are: ignoring position sizing (treating every signal as equal regardless of account size), chasing signals after missing the entry, and continuing with a provider whose drawdown has already exceeded your personal risk tolerance.

    You are reading this because something has not been working. Maybe the signals looked right but the trades kept going wrong. Maybe you made money for a few weeks, then gave it all back. That pattern has a name — and it is almost never about the signal itself.
    Mistake 1
    Treating all signals as equal regardless of market conditions

    A signal generated during a low-volatility Asian session carries a very different risk profile from the same signal firing during a high-impact news event in the London–New York overlap. Most traders apply identical position sizes to both. That is where accounts quietly erode — not in one big loss, but in a dozen trades where the risk was structurally higher than the signal suggested.

    Mistake 2
    Chasing the entry after missing the signal

    The signal arrives. You are in a meeting. You check your phone an hour later and the price has already moved 30 pips in the intended direction. So you enter anyway, hoping it continues. This is one of the most consistent ways to turn a profitable signal service into a losing experience. The signal’s edge was priced in at the original entry — entering late changes the risk-reward entirely.

    Mistake 3
    Ignoring fees until they become the story

    ASIC’s FY2023–24 data shows that 5% of retail CFD clients would have made a net profit but ended up losing because of fees. That is one in twenty traders who did everything right — and still lost. Among active traders executing 50 or more open positions per month, 19% of otherwise-profitable clients were pushed into a loss by fees alone. The signal can be right. The trade can move your way. And fees can still make it a losing month.

    The evidence: ASIC Report 828 found that 74% of new retail clients acquired via paid online advertising lost money in FY2023–24 — worse than the already-grim sector average. If a signal service found you through a social media ad, that context alone is worth factoring into your assessment of it.

    Jordan — remember Jordan from Brisbane — made all three of these mistakes in sequence. Entered late on a GBP signal during NFP week. Used the same lot size as a quiet Tuesday. Did not notice that the spread on his broker had widened to 4.2 pips at the moment of entry. The trade technically hit its target. Jordan still lost money on the round trip. The signal was not wrong. The framework around it was.

    Expert tip: Crazii JTVertex’s personal rule: if a signal arrives more than 15 pips away from the stated entry on a major pair, we skips it entirely. Not because the analysis is wrong — but because the original risk-reward calculation no longer applies. Missing a trade costs nothing. Entering a bad one costs real money.
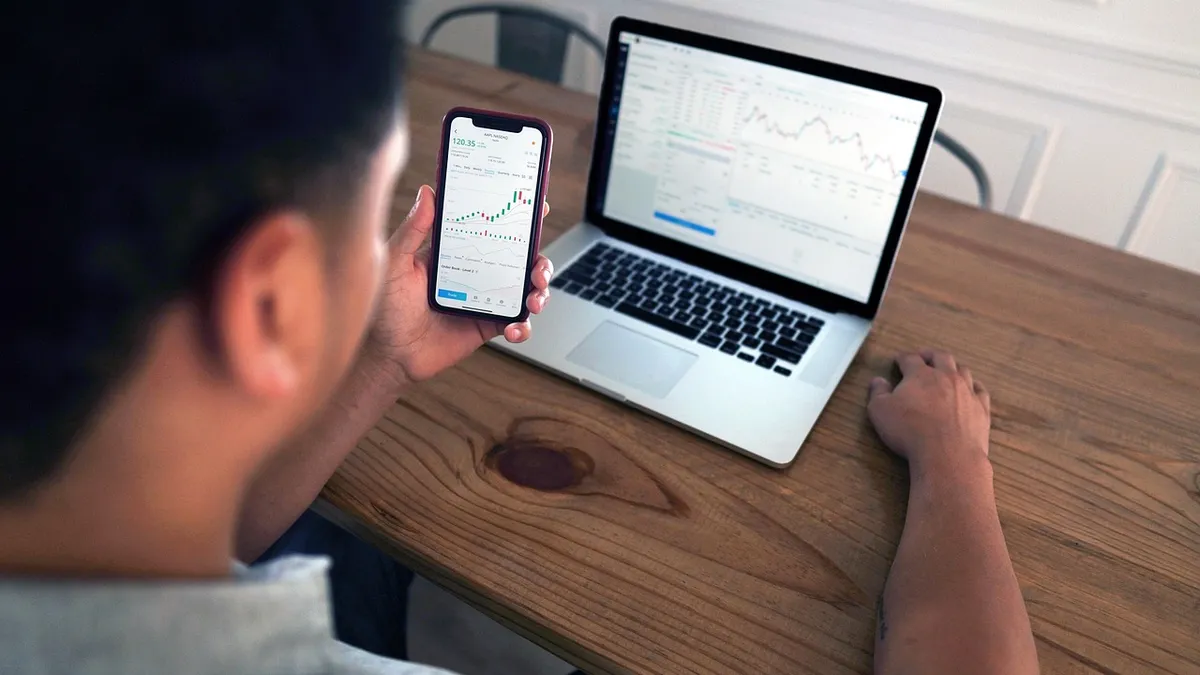
    For a deeper look at why signals underperform even when the analysis is sound, the article on 5 reasons your trading signals keep failing you every week breaks down the structural issues most traders never address.
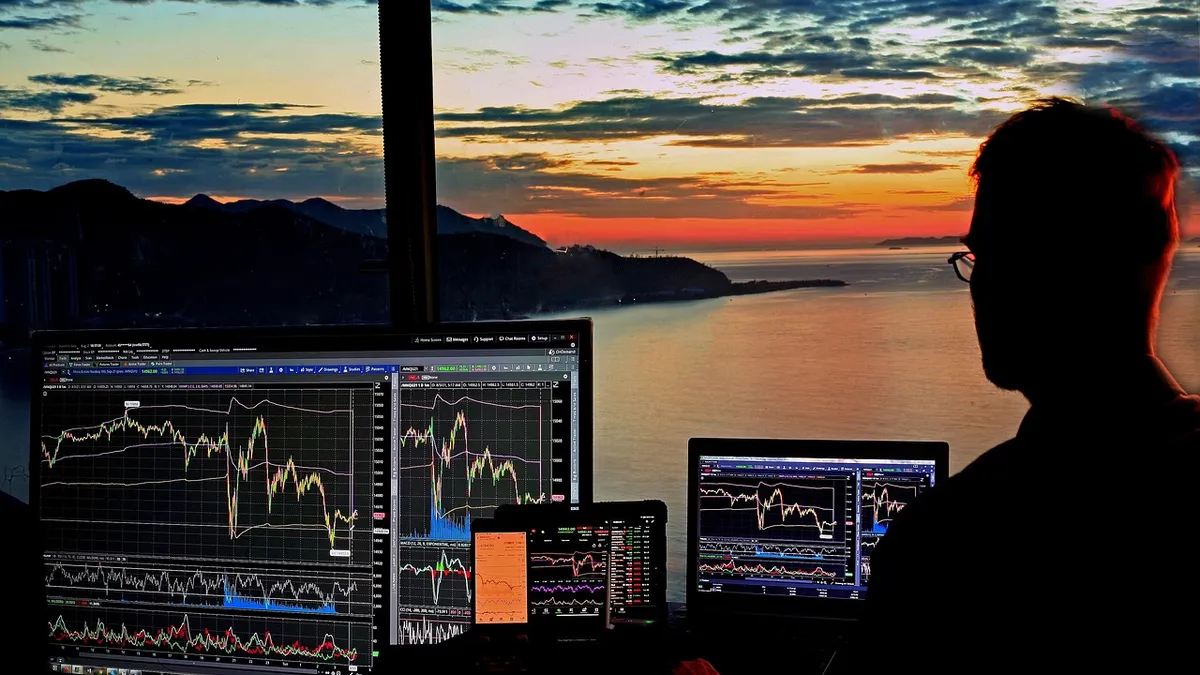
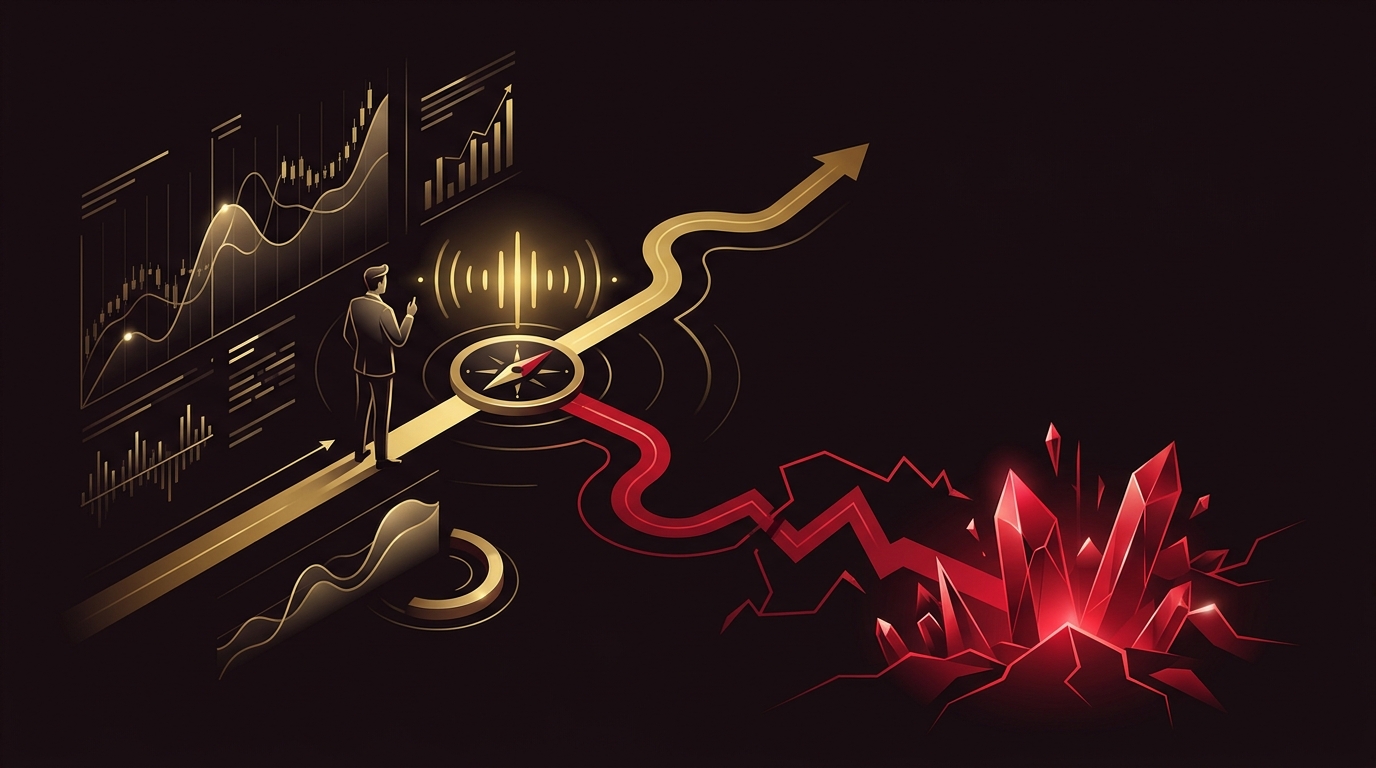
    common mistakes using forex and CFD trading signals — Crazii JTVertex
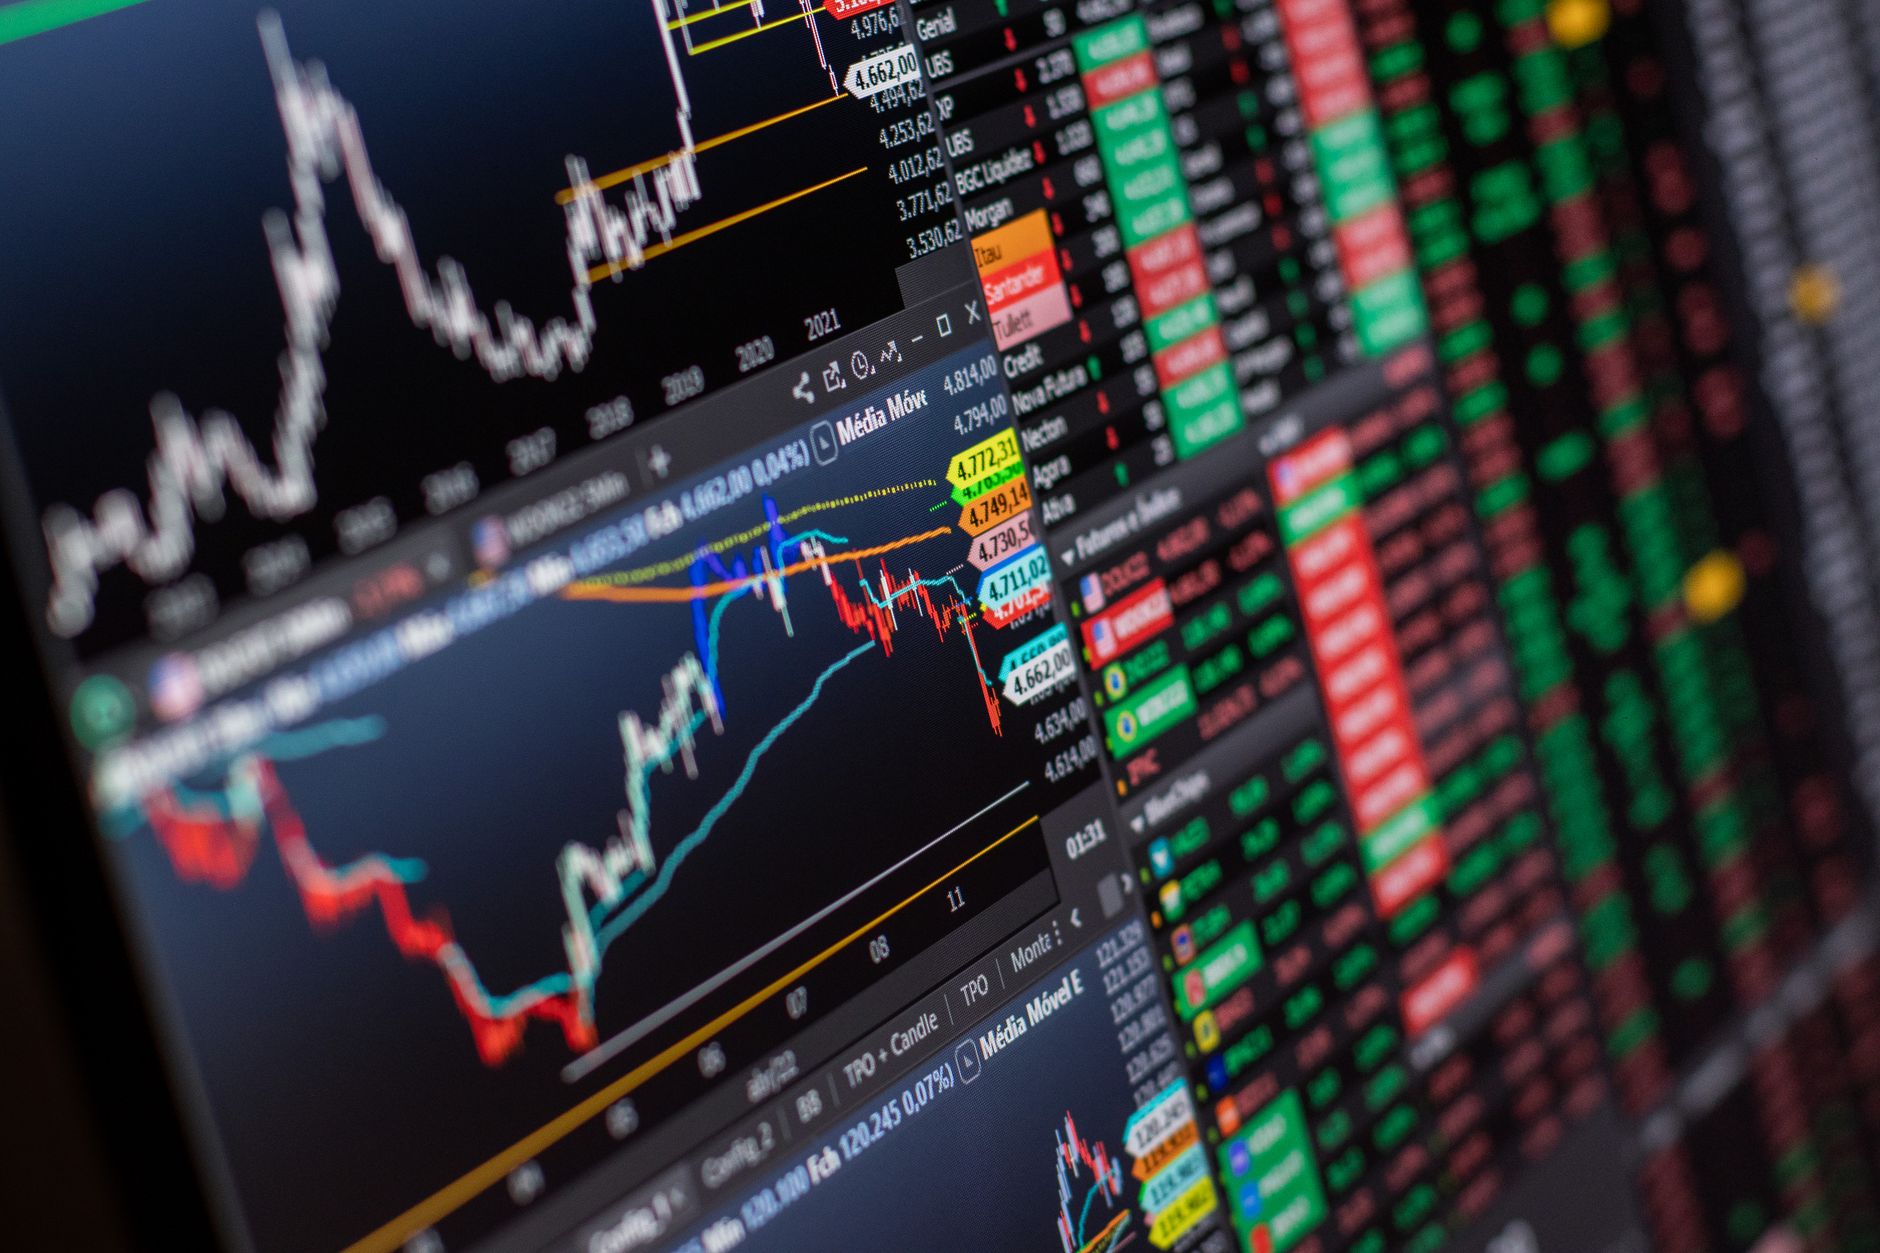
    Understanding signal mistakes helps traders avoid the costly patterns that affect the majority of retail CFD clients in Australia. · Photo: TheInvestorPost / Pixabay

    Ready to use signals with a proper framework around them?

    The AIMS platform gives you structured access to trading tools alongside a community that talks about risk honestly — not just wins.

    Start with AIMS

    How do you evaluate signal quality before risking real money?

    How do you evaluate signal quality before risking real money?
    💡

    Key points: Evaluating signal quality before committing real capital comes down to four measurable criteria: minimum trade sample size (aim for 100+ live trades), maximum drawdown relative to returns, consistency of risk parameters across signals, and whether the logic is explainable in plain language.

    Here is the question most traders never ask before subscribing to a signal service: “What would need to happen for this to stop working?” That question alone will save you more money than any indicator ever will.
    1

    Check the trade sample size first

    Any signal provider with fewer than 100 live trades on record is showing you a sample too small to be statistically meaningful. This is not we being overly cautious — it is basic probability. A service with 30 trades and an 80% win rate could easily be luck. The same win rate across 200 trades starts to mean something. On the MT5 marketplace, this number is visible on every provider’s profile. On Telegram, it almost never is.

    2

    Assess maximum drawdown against the return

    A signal service that returned 60% over 12 months but experienced a 40% drawdown along the way is not a 60% return service — it is a service that required you to stomach losing nearly half your account at some point. Most traders cannot hold through that psychologically, which means they would have exited at the worst moment. The drawdown number is the one that tells you what the experience of following the service actually felt like.

    3

    Verify that risk parameters are consistent across signals

    A legitimate signal always includes an entry zone, a stop-loss level, and at least one take-profit target. If any of those three are missing, the signal is incomplete. More importantly, check whether the stop-loss distance is consistent across signals — or whether it varies wildly. Inconsistent risk parameters suggest the provider is adjusting signals post-hoc rather than running a rule-based system.

    4

    Ask for the logic in plain language

    We always ask one question when evaluating a new signal provider: “Can you explain why this trade was taken in two sentences?” If the answer involves more than two indicators and a vague reference to “confluence,” that is a warning sign. The best signal providers can articulate their edge clearly. Complexity is not sophistication — it is often camouflage.

    Expert tip: Crazii JTVertex’s personal threshold for drawdown is 20%. If a signal service’s historical maximum drawdown exceeds that, we treats it as a high-risk service regardless of the headline return. That threshold is a personal heuristic — not a universal rule — but it has kept we out of several services that looked spectacular on paper and collapsed within six months.

    The evidence: ASIC notes that 85% of retail clients lost money trading options CFDs in FY2023–24 — the highest loss rate of any product category in their report. If a signal service specialises in options CFDs, that context belongs in your evaluation before anything else.
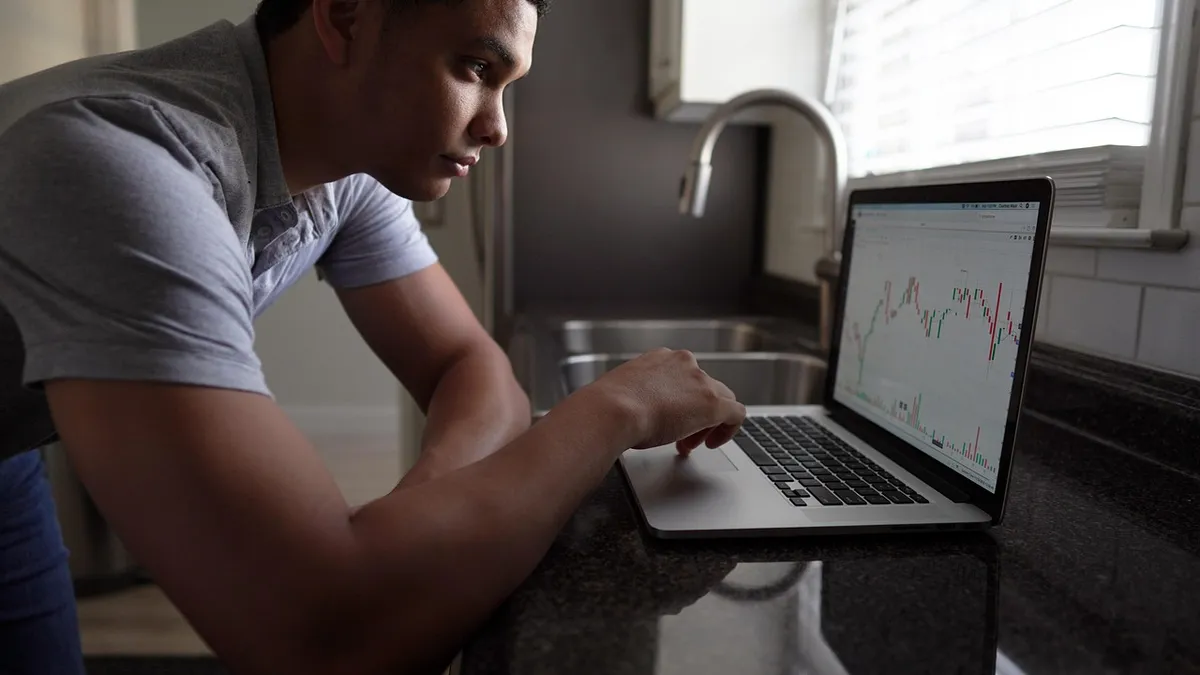
    Jordan eventually found a signal provider on the MT5 marketplace with 340 live trades, a maximum drawdown of 17%, and a clearly documented RSI-based entry system. The RSI oversold threshold used was 30, overbought was 70 — standard Wilder parameters, nothing exotic. Jordan paper-traded it for four weeks before committing real capital. That four-week pause was the single best trading decision Jordan made. For traders who are newer to this process, the guide on what are the best trading signals for beginners right now walks through the evaluation framework in more accessible terms.
    how to evaluate trading signal quality before risking money — Crazii JTVertex
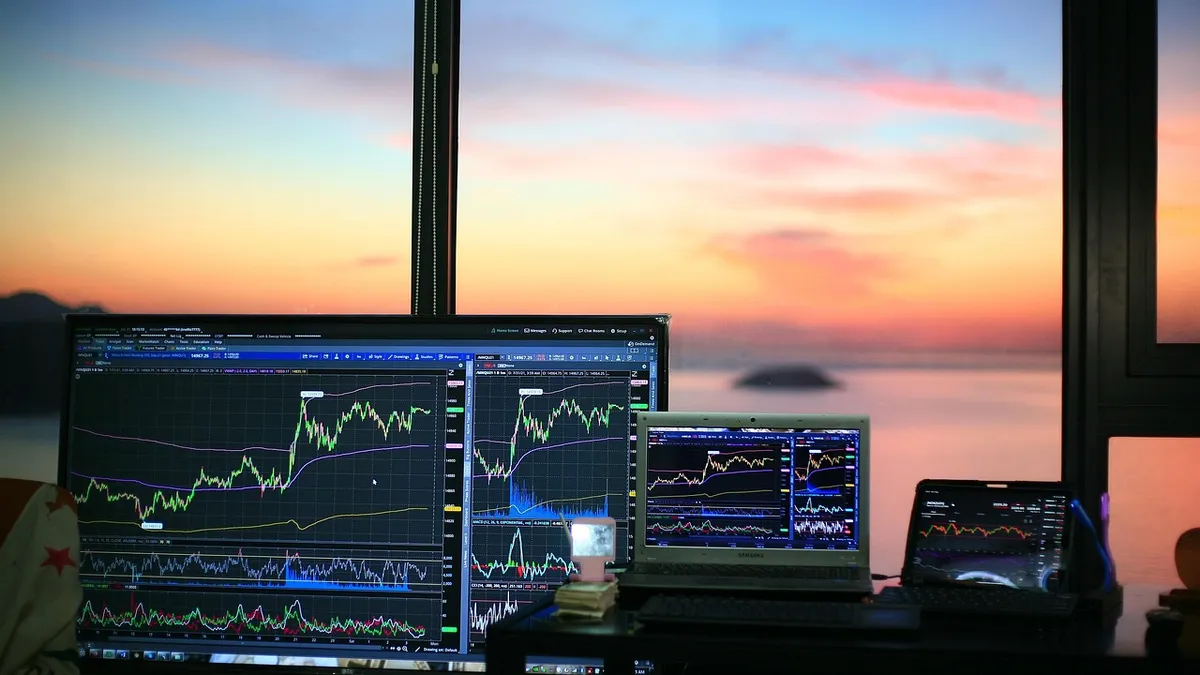
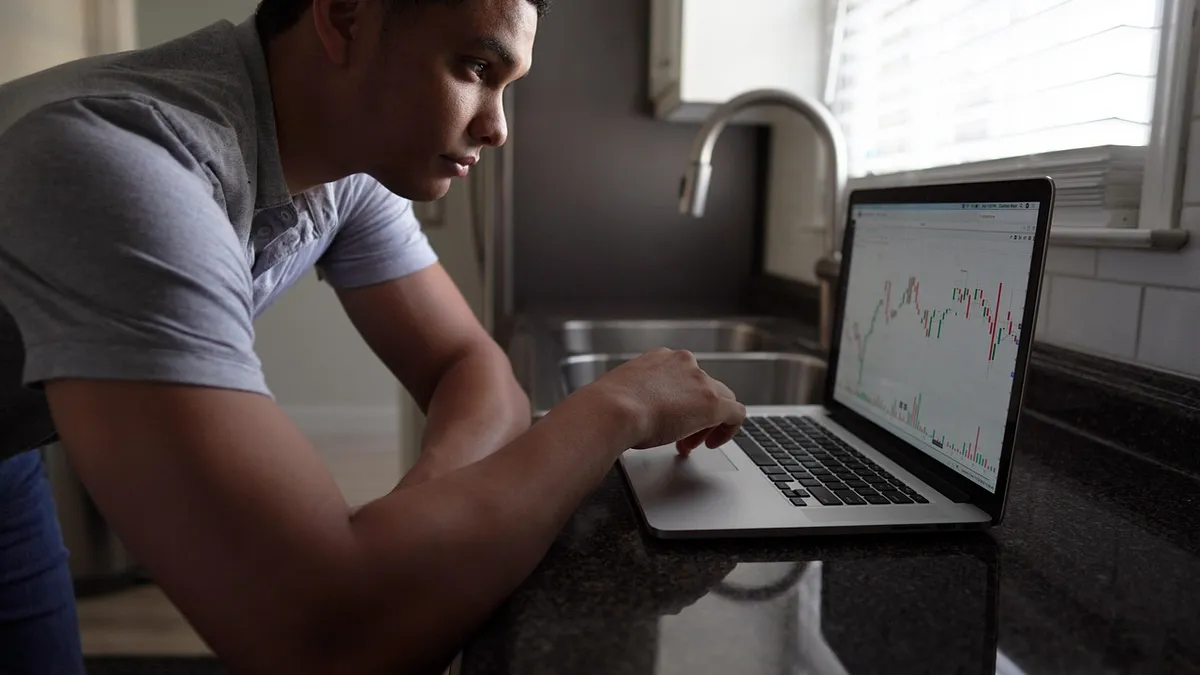
    A structured evaluation process protects traders from costly signal subscriptions that look impressive but underperform in live conditions. · Photo: TheInvestorPost / Pixabay

    Are free trading signals worth using, or do you need a paid service?

    Are free trading signals worth using, or do you need a paid service?
    💡

    Key points: Free trading signals are not inherently worse than paid ones — but they carry a different set of risks. The real question is not cost, it is accountability. Paid services have a financial incentive to maintain performance. Free channels have no such constraint, which changes the dynamic entirely.

    This is the question we get asked most often from traders just starting out. And the honest answer is: it depends on what the free signal is actually costing you. Free does not mean no cost. A free Telegram signal that sends you into a trade with no stop-loss, at 3 AM, on a pair you have never traded — that signal has a cost. You just do not see it on a subscription invoice. That said, free signals can be a genuinely useful starting point — if you treat them as educational material rather than instructions to follow with real money. The MT5 Signals marketplace includes free providers alongside paid ones, and some of the free providers have track records that rival the paid alternatives. The difference is in the accountability structure, not the price tag. Here is the real distinction worth making: paid signal services that charge a monthly fee have a reason to maintain performance — unhappy subscribers cancel. Free channels, particularly on Telegram, have no such mechanism. The provider can post a bad signal, delete it, and post a screenshot of a winner. There is no audit trail. That asymmetry is what makes free signals structurally riskier, not the price.

    The evidence: The MetaTrader 5 Signals marketplace hosts over 3,200 free and commercial signal providers, with full live trade histories visible to subscribers before they commit. That transparency is the feature — not the price point. A free provider with 200 live trades and a visible drawdown history is more trustworthy than a paid Telegram channel with screenshots.

    Expert tip: We used free MT5 signals for the first three months of evaluating a new strategy. Not to trade them — but to watch how the provider handled losing streaks. A provider who goes quiet during a drawdown and only posts when winning is telling you everything you need to know about their risk management culture. The behaviour during bad weeks matters more than the performance during good ones.
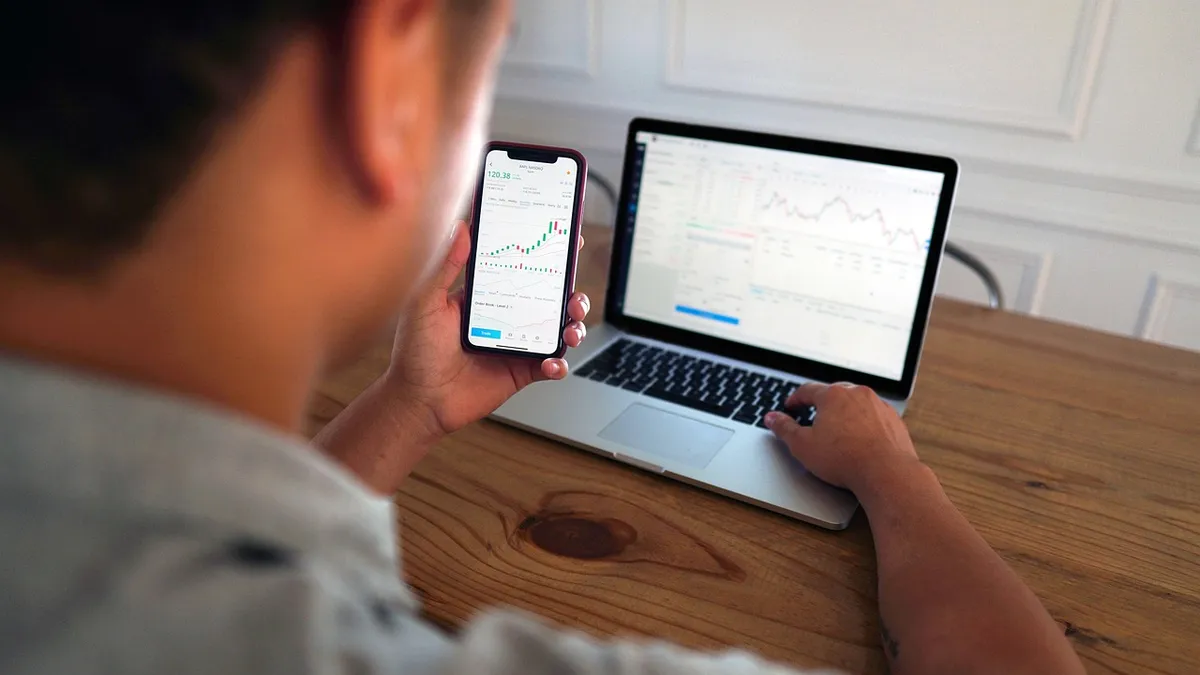
    Who should avoid free signals entirely? Anyone who cannot yet distinguish between a signal with a defined stop-loss and one without. If you cannot read the risk parameters on a signal and immediately know whether it fits your account size, free signals will cost you more than a paid subscription would. That is not a judgement — it is just the practical reality of where the risk sits. The bottom line: use free signals to learn, to compare, and to build your evaluation instincts. Use paid services when you have enough context to hold them accountable for what they promise.
    free versus paid trading signals comparison for Aussie traders — Crazii JTVertex
    The choice between free and paid trading signals comes down to accountability structures, not price — a critical distinction for Australian retail traders. · Photo: TheInvestorPost / Pixabay

    Frequently asked questions about trading signals for Aussie traders
    Frequently asked questions about trading signals for Aussie traders
    💡

    Key points: These are the questions Australian traders ask most often about signal services — answered directly, without the hedging that makes most FAQ sections useless.

    How many trades does a signal provider need before I can trust their track record?

    Treat anything under 100 live trades as insufficient. That is a personal heuristic from we, not a regulatory standard — but below that threshold, a run of luck is indistinguishable from a genuine edge. On the MT5 marketplace, filter for providers with 100 or more trades before looking at anything else.

    Are trading signals legal in Australia?

    Providing financial product advice in Australia generally requires an Australian Financial Services (AFS) licence under the Corporations Act. Signal services that make specific trade recommendations to Australian retail clients may be providing financial advice. If you are unsure about a provider’s regulatory status, check ASIC’s professional register at moneysmart.gov.au before subscribing.

    Can copy trading replace manual signal following for Australian traders?

    Copy trading automates the execution of signals from a chosen provider, which removes the emotional element of manual entry. ASIC recorded 26,243 retail clients using copy trading in FY2023–24. It is growing — but it does not remove the need to evaluate the underlying provider. You are still choosing whose strategy to copy, and that choice carries all the same risks.

    What is a realistic win rate for a good trading signal service?

    Win rate alone is not a useful metric. A service with a 55% win rate and a 2:1 reward-to-risk ratio outperforms one with a 75% win rate and a 0.5:1 ratio over time. Focus on the combination of win rate and average win-to-loss ratio — that gives you a clearer picture of long-term expectancy than either number alone.

    Should I use trading signals if I am completely new to trading?

    Signals can be useful for beginners as a learning tool — but only if you understand what you are following and why. Using signals without understanding the underlying logic creates dependency rather than skill. Start by paper trading signals for at least four weeks before using real capital, and use that time to learn why each trade was taken, not just whether it won.

    Want to talk through your signal strategy with someone who gets it?

    Crazii JTVertex is here to help Australian traders build a proper framework — not just hand you signals and wish you luck. Get in touch directly.

    Contact Crazii JTVertex

    Note: Trading signals, CFDs, and margin foreign exchange products are high-risk financial instruments. ASIC data shows that 68% of retail CFD clients in Australia lost money in FY2023–24, with net losses exceeding $458 million. This article is general information only and does not take into account your personal financial situation, objectives, or risk tolerance. Always read the relevant Product Disclosure Statement and consider seeking independent financial advice before trading.
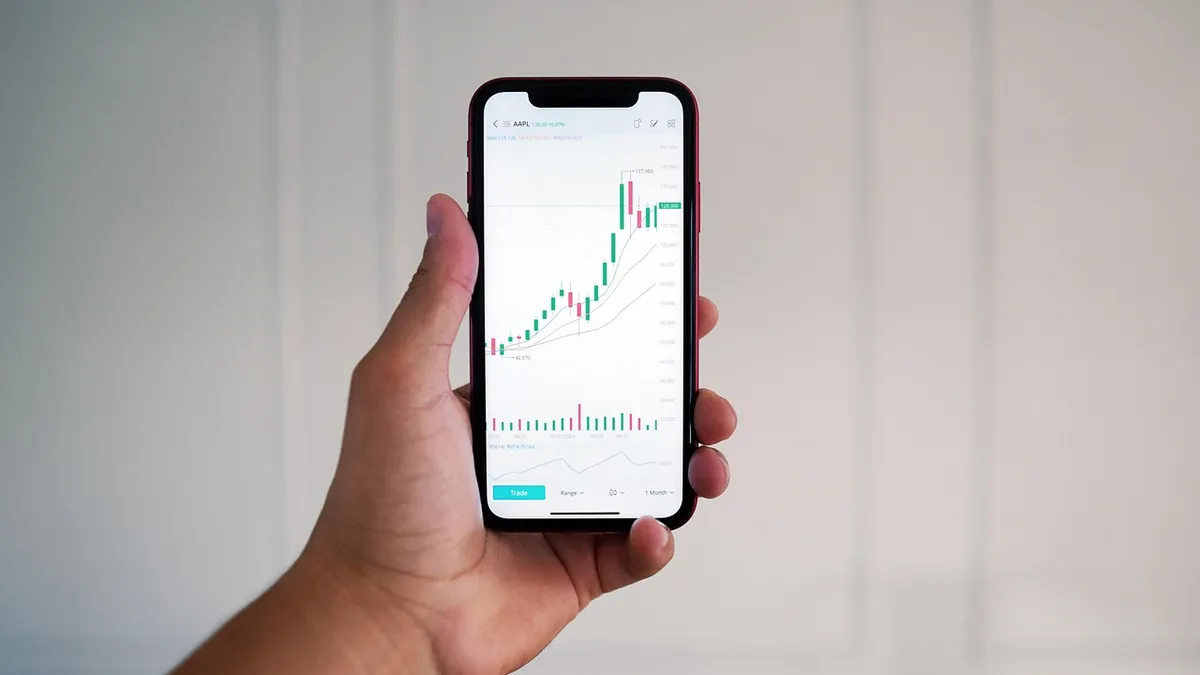

  • Who Gives Best Trading Signals and Can You Actually Trust Them

    Who Gives Best Trading Signals and Can You Actually Trust Them

    If you have ever asked who gives best trading signals, you already know the honest answer is harder to find than any Telegram channel or YouTube guru will admit. At Crazii JTVertex, we has spent years testing signal providers, copy-trading platforms, and automated alert systems across live accounts, and the full picture of what actually works is laid out in this guide on who gives the best trading signals and whether you can trust them. By the time you finish reading, you will know exactly which type of signal source fits your situation, which red flags to avoid before you risk a single dollar, and how to build a simple filter that separates genuine edge from expensive noise.

    Important note: This article is general information only and does not constitute personal financial advice. Trading CFDs, forex, and other leveraged products carries significant risk of loss. Please consider your own financial circumstances and read the relevant Product Disclosure Statement before acting on any signal or trading tool.

    Start with the right tools, not just the right signals

    Crazii JTVertex has put together a full trading toolkit for Australian traders — signals, platforms, and support in one place.

    See the 2026 toolkit
    Table of contents

    Who actually gives the best trading signals — and what makes one “best”?

    Who actually gives the best trading signals — and what makes one "best"?
    💡

    Key points: The best trading signals come from providers with a verified, audited track record across at least 100 closed trades, transparent drawdown figures, and a clear methodology you can understand. No single provider is universally best — the right one depends on your instrument, risk tolerance, and available screen time.

    Here is the thing nobody wants to say out loud: there is no single provider who gives the best trading signals for every trader. Full stop. That sounds like a cop-out, but it is actually the most useful starting point you can have. Because once you stop searching for a universal answer and start asking “best for whom, in what market, with what risk settings” — you start making decisions that actually protect your capital. So what does “best” mean in practice? We would argue it comes down to three things: verifiability, consistency across market conditions, and fit with your own trading style. Verifiability means the track record is audited or at minimum independently verifiable — not a screenshot of a Telegram post. Consistency means the provider has performed across both trending and ranging markets, not just during one bull run. Fit means the signal frequency, instrument focus, and risk-per-trade align with how you actually trade. There are broadly four types of signal sources you will encounter. First, human analysts — experienced traders who publish entry, stop-loss, and take-profit levels, usually via Telegram or email. Second, algorithmic systems — rule-based engines that scan for technical setups and fire alerts automatically. Third, copy-trading platforms — where you mirror another trader’s live account in real time. Fourth, broker-integrated tools — signals built into platforms like MetaTrader, which hosts over 3,200 free and commercial signal providers through its built-in marketplace. Each has a different risk profile. Human analysts can adapt to news events but are subject to emotional bias. Algorithms are consistent but can break down when market structure shifts. Copy trading gives you live exposure to someone else’s edge — but also to their drawdowns, which can be severe. The question worth sitting with before you subscribe to anything is this: can you actually verify what this provider claims? That single question is what separates traders who find a source that genuinely gives best trading signals from those who keep cycling through disappointment.

    The evidence: According to MetaQuotes, the MetaTrader platform alone hosts more than 3,200 free and commercial signal providers through its built-in signals marketplace. With that volume, the challenge is not finding a signal — it is filtering out the noise from the genuine edge.

    Expert tip from Crazii JTVertex: We has a personal rule that gets ignored constantly: never evaluate a signal provider on win rate alone. A provider with a 45% win rate and a 1:3 risk-reward ratio will outperform a 75% win-rate provider with a 1:0.8 ratio over 200 trades. The first time we ignored this rule was on a gold signals channel in 2022 — the win rate looked impressive, but the average loss was nearly three times the average win. The account dropped 22% in six weeks. That lesson cost real money.

    Signal source type Verifiability Adaptability to news Typical frequency Best suited to
    Human analyst Medium (check track record) High 1–5 per day Traders who want context
    Algorithmic system High (if backtested, audited) Low 5–50+ per day Systematic traders
    Copy trading High (live account data) Depends on master trader Varies Passive, hands-off traders
    Broker-integrated tools Medium (platform-verified) Medium Varies Beginners and part-time traders
    who gives best trading signals comparison chart Crazii JTVertex
    Comparing signal source types helps Australian traders choose the right fit for their style and risk profile. · Photo: 3844328 / Pixabay
    The next section will show you what the actual data says about signal-following outcomes — and the numbers from Australia’s own regulator are the kind that make you read them twice.

    What does the evidence say about trading signals and real-world outcomes?

    What does the evidence say about trading signals and real-world outcomes?
    💡

    Key points: ASIC’s most recent data shows 68% of Australian retail CFD clients lost money in FY2023–24, with net losses exceeding $458 million. Fees alone cost traders $73 million and flipped 5% of otherwise-profitable clients into a loss. Signal-following does not change these structural dynamics unless the underlying edge is real.

    Let we give you a number that reframes this entire conversation. In FY2023–24, 68% of retail CFD clients in Australia lost money. That is not a fringe statistic — it comes directly from ASIC Report 828, published in January 2026, covering the full Australian CFD sector. In raw terms: 133,674 retail clients lost money, with net losses exceeding $458 million for the year. To put that in everyday terms, that is roughly the equivalent of every adult in a mid-sized Australian city like Toowoomba collectively losing their savings in a single financial year. The fees picture is worth understanding separately. Of that $458 million in net losses, $73 million was fees. And here is the detail that stings: 5% of retail clients would have made a net profit if not for fees. Fees alone tipped them from profit into loss. Think about that — they had the right calls, they followed the signals, and the transaction costs still wiped their edge. Now, where do signals and copy trading sit in this picture? ASIC’s same report notes that 26,243 retail clients used copy trading in FY2023–24, with ASIC observing “a growing interest in copy trading.” That is a meaningful number. But copy trading does not automatically improve outcomes — it simply transfers the edge (or lack of it) from one trader to another. If the master trader you are copying genuinely gives best trading signals with a verified edge, you benefit. If they do not, you share their losses. There is also a sobering finding for active traders. Among clients who opened 50 or more positions per month, 19% of those who would otherwise have been profitable ended up losing after fees. More trading, in other words, correlated with worse outcomes — not better ones.

    The evidence: ASIC Report 828 (January 2026) found that 85% of retail clients lost money trading options CFDs — the highest loss rate of any CFD product category. Standard CFDs already sit at 68%. If a signal provider is pushing options CFDs heavily, the structural headwind against profitability is severe.

    Expert tip from Crazii JTVertex: We checks the drawdown curve of any signal provider before the win rate. A smooth equity curve that suddenly has a vertical drop tells you everything: either the provider hit a structural market change they were not prepared for, or — more often — they were using a martingale or grid strategy that looked good until it did not. If the provider cannot explain what caused the drawdown and what changed in their system afterwards, that is a hard pass.

    What this data tells you is not “signals do not work.” It tells you that signals used without understanding the underlying risk, fees, and market structure will, on average, produce the same outcomes as the broader retail population. The traders who beat that 68% figure are the ones who treat signal evaluation as seriously as signal execution. For a deeper look at the tools that support genuine signal analysis, the best trading signals and tools for Australian traders in 2026 covers the full landscape with specific platform recommendations.
    ASIC retail CFD loss statistics trading signals Australia Crazii JTVertex
    ASIC Report 828 data on retail CFD outcomes provides essential context for evaluating any trading signal source. · Photo: Pexels / Pixabay

    Want to see which signal tools Crazii JTVertex actually uses?

    Join the group chat for live discussion, signal breakdowns, and platform walkthroughs from traders who have been through the numbers.

    Join the Telegram group
    Understanding the data is one thing. Knowing how to apply it when you are comparing actual providers is where most traders fall short — and that is what the next section addresses.

    How do you compare signal providers before trusting them with your capital?

    How do you compare signal providers before trusting them with your capital?
    💡

    Key points: Comparing signal providers requires looking beyond win rate to include drawdown depth, trade sample size (minimum 100 closed trades), fee structure, and whether results are audited or self-reported. A provider with a short track record in a trending market tells you almost nothing about their edge in a ranging or volatile environment.

    Picture this: you find a Telegram channel with 47,000 members, a pinned message showing a 91% win rate over the last three months, and testimonials from people saying they doubled their accounts. You are tempted. Of course you are. Here is what we does before subscribing to anything. First, sample size. We will not seriously evaluate any provider with fewer than 100 closed trades on record. Three months of forex signals might only be 60–80 trades. That is not enough to distinguish genuine edge from a lucky streak. This is a personal heuristic, not a statistical rule — but it has saved we from at least four providers who looked great on paper and fell apart within two months. Second, drawdown. Maximum drawdown tells you the worst peak-to-trough loss the provider experienced. A 20% drawdown is a significant red flag in we’s view — not because it cannot recover, but because it tells you about position sizing and risk management. If a provider never discloses drawdown, that is itself a red flag. Third, audit trail. Is the track record self-reported (screenshots, Telegram posts) or independently verifiable (MetaTrader signals page, a third-party auditing service)? Self-reported results are almost always cherry-picked. We treats them as marketing, not evidence. Fourth, fee drag. As the ASIC data makes clear, fees are a material factor in net outcomes. A signal service charging per trade, combined with spreads and overnight financing costs, can erode a profitable strategy into a losing one. Always calculate total cost of following the signal, not just the subscription fee.

    The evidence: ASIC Report 828 found that 74% of new retail clients acquired via paid online advertising lost money in FY2023–24 — worse than the 68% sector average. Providers who rely heavily on paid ads to acquire clients are, statistically, associated with worse client outcomes. That does not make every advertised signal bad, but it is worth noting.

    Expert tip from Crazii JTVertex: One thing we looks for that almost nobody mentions: does the signal provider post their losses in real time, or only after the trade closes? Providers who post “entry now” and then go quiet until a winner appears are hiding their stop-outs. The best providers we has worked with post every stop-loss hit as it happens, with a brief note on why the setup failed. That transparency is worth more than any win-rate figure — and it is one of the clearest signs of a source that genuinely gives best trading signals rather than just best-looking marketing.

    1

    Check the sample size

    Look for at least 100 closed trades before drawing any conclusions about a provider’s edge. Fewer trades and you are evaluating luck, not skill.

    2

    Examine the drawdown history

    Request or find the maximum drawdown figure. In we’s view, anything above 20% warrants a detailed explanation from the provider about their risk controls.

    3

    Verify the audit trail

    Prefer providers whose results are verifiable on the MetaTrader signals page or a third-party auditing service. Screenshots are not evidence.

    4

    Calculate total cost of following

    Add subscription fees, spreads, commissions, and overnight swap costs. Then assess whether the signal’s historical edge survives those costs at your account size.

    5

    Test on a demo account first

    Follow the signals on a demo account for at least four weeks before committing live capital. This reveals execution slippage, signal timing issues, and whether the style actually suits how you trade.

    For traders who want to go deeper on evaluating specific TradingView-based tools alongside signal providers, the guide on best trading signals and TradingView indicators ranked this year walks through the specific tools worth considering.
    how to evaluate trading signal providers step by step Crazii JTVertex
    A structured evaluation process helps you separate verified trading signal providers from those relying on self-reported results. · Photo: TheInvestorPost / Pixabay

    Ready to look at signals through a platform built for it?

    AIMS gives you access to a regulated trading environment where you can evaluate and execute signals with proper risk controls in place.

    Open an AIMS account
    You now have a framework for evaluating providers. But even with the right provider, there are four mistakes that consistently destroy accounts — and mistake number three is the one almost nobody talks about.

    What are the most costly mistakes traders make when following signals?

    What are the most costly mistakes traders make when following signals?
    💡

    Key points: The most damaging mistakes when following trading signals are over-leveraging relative to the signal’s risk settings, ignoring stop-losses because “the trade looks like it will recover,” following too many signal sources simultaneously, and failing to account for fee drag on net returns. Each of these can turn a genuinely profitable signal into a losing experience.

    Meet James. He is a 34-year-old project manager in Brisbane who started following a forex signal service in early 2024. The provider had a solid track record — 14 months of verified results on MetaTrader, a reasonable drawdown, and clear entry and exit levels. James did everything right in the evaluation phase. Then he made three of the four mistakes below.
    Mistake 1
    Over-leveraging relative to the signal’s risk settings

    Most signal providers calibrate their risk-per-trade to a specific account size or percentage. James was using 3x the suggested position size because he wanted faster results. When the provider hit a drawdown period — which every provider eventually does — James’s account dropped far harder than the signal’s own track record suggested. The signal was performing as advertised. James’s account was not.

    Mistake 2
    Moving or removing stop-losses mid-trade

    The signal said: entry at 1.0850, stop at 1.0820, target at 1.0910. James watched the trade go against him to 1.0825 and moved his stop to 1.0790 because he “felt” the trade would recover. It did not. This is the single most common way traders take a signal with a defined risk and turn it into an undefined loss. The stop-loss is not optional.

    Mistake 3
    Following multiple conflicting signal sources simultaneously

    James subscribed to three signal channels at once. One said buy EUR/USD. Another said sell. The third said wait. He ended up with contradictory positions open at the same time, hedging himself into guaranteed losses on fees.

    This is a trap that catches traders who are still searching for who gives best trading signals rather than committing to one verified source. One signal source, evaluated properly and followed consistently, almost always outperforms the noise of three mediocre ones.

    Mistake 4
    Ignoring the cumulative cost of fees

    Recall from the ASIC data: fees flipped 5% of otherwise-profitable retail clients into a net loss in FY2023–24. James was paying a monthly subscription, plus spreads, plus swap fees on positions held overnight. He had never calculated whether the signal’s historical edge was large enough to survive all three. It was not, at his position sizes.

    The evidence: Among active retail CFD traders in Australia — those with 50 or more open positions per month — 19% of those who would otherwise have been profitable ended up losing money after fees (ASIC Report 828, January 2026). Higher trading frequency does not improve outcomes; it typically worsens them through fee accumulation.

    Expert tip from Crazii JTVertex: We has a rule for clients who are new to signal-following: paper-trade the signals for 30 days before going live, and during that period, write down every time you would have moved a stop or exited early. At the end of 30 days, calculate what your actual P&L would have been versus what the signal’s P&L was. The gap between those two numbers is the cost of your own psychology. It is almost always larger than people expect.

    James eventually got back on track — but only after simplifying to one signal source, respecting the position sizing, and setting a rule that his stops could never be moved further from entry. That is the after. The bridge was recognising that the signal was not the problem; the execution was. For traders building a more systematic approach to avoiding these mistakes, the article on how to build a trading system from scratch in 9 steps gives a structured framework that complements any signal service.
    common mistakes following trading signals Australian traders Crazii JTVertex
    Understanding the most common signal-following mistakes helps Australian traders protect their capital even when using a verified provider. · Photo: TheInvestorPost / Pixabay

    Which type of signal source suits Australian traders in 2026?

    Which type of signal source suits Australian traders in 2026?
    💡

    Key points: For Australian traders in 2026, the most suitable signal source depends on available screen time, instrument preference, and experience level. Part-time traders with limited screen time often benefit most from copy trading or broker-integrated alerts. Active traders with technical knowledge get more from algorithmic systems with clear methodology. Both groups need to verify the source before committing capital.

    Right, so who is this actually for? If you are reading this, you are probably not a full-time institutional trader with a team of analysts. You are likely trading around a job, a family, and the general chaos of life in Australia. That context matters enormously when choosing a signal source — and it shapes the answer to who gives best trading signals for your specific situation. For part-time traders — people who can check their phone between meetings but cannot stare at charts all day — copy trading through a verified platform is often the most practical option. You set your risk parameters, connect to a master trader whose track record you have verified, and the trades execute automatically. The key word there is “verified.” The 26,243 Australian retail clients using copy trading in FY2023–24 were not all having the same experience. The ones who did their due diligence on the master trader they were copying fared meaningfully better than those who picked based on recent returns alone. For traders with more screen time and some technical background, algorithmic signal systems tied to specific indicators — RSI crossovers at the standard 30/70 thresholds, moving average confluence, volume-weighted setups — give you more control over what you are following and why. You can backtest the logic. You can understand when the signal is likely to fail. That understanding is itself a form of edge. For traders who are newer to the market, we would say this plainly: start with a tool, not a signal. A good indicator that teaches you to read price action is more valuable long-term than a signal that tells you what to do without explaining why. The why is what you take with you when the signal provider disappears or changes their approach.

    The evidence: The Australian CFD client base has contracted significantly — from approximately 515,000 active clients per quarter before ASIC’s product intervention measures (in the 12 months before March 2021) to 119,300 active clients per quarter in FY2023–24 (ASIC Report 828, January 2026). The traders who remained active through that contraction are, on average, more experienced and more selective about the tools and signals they use.

    Expert tip from Crazii JTVertex: Crazii JTVertex’s view on this is straightforward: the best signal source for an Australian part-time trader in 2026 is one that comes with an explanation. Not just “buy EUR/USD at 1.0850” but “buy EUR/USD at 1.0850 because price has retested the 4H demand zone, RSI is recovering from below 30, and the London session open is in 45 minutes.” That explanation is what lets you build judgment over time, rather than staying dependent on someone else’s calls forever.

    Not everyone is suited to signal-following, and we thinks it is worth saying that plainly. If you cannot follow a stop-loss consistently — if you know from experience that you will move it when the trade goes against you — then copy trading (where the execution is automated) is a better fit than manual signal-following. Self-knowledge here is a genuine edge. For traders who want to see how the world’s top signal sources compare specifically for the Australian market, the best trading signals in the world ranked for Aussie traders in 2026 gives a direct comparison across the leading providers.
    best trading signal sources for Australian traders 2026 Crazii JTVertex
    Matching the right signal source type to your trading style and available time is the first step to using signals effectively in 2026. · Photo: TheInvestorPost / Pixabay

    Frequently asked questions about trading signals

    Frequently asked questions about trading signals

    Can trading signals guarantee a profit?

    No signal provider can guarantee profit. Trading CFDs and leveraged products carries significant risk, and even verified providers with strong track records experience losing periods. ASIC data shows 68% of Australian retail CFD clients lost money in FY2023–24, regardless of the tools they used.

    How many trades should a signal provider have on record before I trust them?

    In we’s view, a minimum of 100 closed trades is a reasonable starting point for evaluation. Fewer trades make it difficult to distinguish genuine edge from a short-term lucky run, particularly in trending market conditions.

    Is copy trading the same as following trading signals?

    They are related but different. Copy trading automatically replicates another trader’s live positions in your account. Trading signals give you entry, stop-loss, and take-profit levels that you execute manually. Copy trading removes execution discretion; manual signals require you to act on each alert yourself.

    Are free trading signals worth following?

    Some free signals have genuine value, particularly those provided through verified platforms like MetaTrader’s signals marketplace. However, free signals require the same evaluation criteria as paid ones — track record, drawdown, sample size, and methodology. Free does not mean low-risk.

    What should I do if a signal goes against me immediately after entry?

    Follow the stop-loss as defined by the signal. Moving or removing a stop-loss because a trade is temporarily in drawdown is one of the most common ways traders turn a defined risk into an undefined loss. If you cannot follow the stop consistently, consider copy trading where execution is automated.

    Want to talk through your signal setup with someone who has done this?

    Crazii JTVertex is available for direct conversation — whether you want to review a signal provider, discuss platform options, or build a clearer trading approach.

    Get in touch

    General information disclaimer: The content on this page is general information only and does not take into account your personal financial situation, objectives, or needs. It is not personal financial advice. Trading leveraged products such as CFDs carries a high level of risk and may not be suitable for all investors. You may lose more than your initial deposit. Please read the relevant Product Disclosure Statement and consider seeking independent financial advice before making any trading decisions. Past performance is not indicative of future results.

  • How to Build a Trading Strategy That Survives a Bear Market

    How to Build a Trading Strategy That Survives a Bear Market

    Learning how to build a trading strategy that actually holds up when markets turn ugly is the difference between surviving a bear market and watching months of gains disappear in a fortnight. At Crazii JTVertex, we have worked with Australian traders at every level — from those placing their first CFD trade to those managing five-figure accounts — and the pattern is always the same: the traders who endure downturns built their strategy before the crash, not during it. This article will walk you through exactly how to construct a bear-market-resilient trading strategy, step by step, so that by the time you finish reading you will have a clear framework you can start applying this week. That is the promise. We will close it at the end.

    Note: This content is general information only and does not constitute personal financial advice. Trading CFDs and margin FX products carries significant risk. You should consider your own financial circumstances and read all relevant Product Disclosure Statements before trading. If in doubt, seek advice from a licensed financial adviser.
    Not sure where to start with trading tools?

    Crazii JTVertex has put together a free resource hub for Australian traders — signals, tools, and community support in one place.

    See the 2026 Trading Tools Guide
    Table of contents

    What does it actually mean to build a trading strategy for a bear market?

    What does it actually mean to build a trading strategy for a bear market?
    💡

    Key points: A bear-market trading strategy is a structured, rules-based plan that defines entry, exit, position sizing, and risk limits specifically for falling or volatile markets. It is built before conditions deteriorate — not as a reaction to them — so decisions are made on logic, not fear.

    Picture this: it is a Tuesday afternoon in late 2022, and a trader named Marcus — 34, based in Brisbane, working as a project manager — is watching his open positions bleed red across three screens. He had a plan for a bull run. He had no plan for this. Most traders build strategies for the market they want, not the market they have. That is the core mistake. A bear market does not announce itself with a polite warning; it arrives when sentiment shifts, liquidity dries up, and the signals that worked beautifully six months ago start firing false positives at an alarming rate. So what is a bear-market trading strategy, actually? It is a documented, rules-based framework that answers five questions before any position is opened: What am I trading? Under what conditions do I enter? Where is my stop? How much of my account am I risking on this single trade? And at what point do I stop trading entirely and step back? The word “documented” matters more than most traders realise. A strategy that lives in your head is not a strategy — it is a preference. Preferences evaporate the moment a position moves against you and your palms start sweating. Bear markets also change the statistical environment your strategy operates in. Correlations between assets that normally behave independently tend to spike. Volatility expands. Spreads widen. If your strategy was calibrated on calm, trending conditions, it will produce different outcomes — often worse ones — when those conditions vanish.

    The evidence: According to ASIC’s Report 828 (published January 2026, covering FY2023–24), 68% of retail CFD clients in Australia lost money over the financial year — that is more than two in three traders. In raw numbers, 133,674 retail clients recorded net losses exceeding $458 million. That figure includes $73 million in fees alone. In other words, for every three Australian traders you know, statistically two of them ended the year behind.

    Expert tip: Crazii JTVertex has reviewed hundreds of trader setups, and the single most consistent gap is this: traders define their entry rules in detail but leave their exit rules vague. “I’ll exit when it looks bad” is not an exit rule. The moment you are under pressure, “looks bad” becomes “looks catastrophic” — and by then the loss is already locked in. Write your exit rule before you write your entry rule. Always.

    1

    Write down your strategy — every rule, every condition

    Open a document right now. Not a spreadsheet, not a mental note. A document. Write the five questions above and answer each one in plain language. If you cannot answer all five, you do not yet have a strategy — you have a trading idea.

    2

    Stress-test your assumptions against falling-market conditions

    Look at your entry signals. Now ask: would these signals have triggered during the ASX downturn of early 2020 or the rate-hike selloffs of 2022? If your strategy has never been applied mentally to a bear scenario, it has not been built for one.

    how to build a trading strategy for a bear market — Crazii JTVertex
    A rules-based trading strategy built before market conditions deteriorate — the foundation of bear-market resilience. · Photo: Pexels / Pixabay
    The next section is where most traders get uncomfortable. Because defining risk parameters means putting a hard number on how much you are willing to lose. And almost nobody wants to do that before they have to.

    How do you define your risk parameters before a single trade is placed?

    How do you define your risk parameters before a single trade is placed?
    💡

    Key points: Risk parameters are the numerical limits — per-trade risk, maximum drawdown, and daily loss cap — that prevent a bad day from becoming a blown account. In a bear market, these numbers must be set more conservatively than in trending conditions, because volatility amplifies both gains and losses.

    Here is the question Marcus asked himself after that Tuesday in 2022: “If I had known the market was going to do this, what would I have done differently?” The answer, when he was honest, was simple. He would have traded smaller. He would have set a daily loss limit. He would have stopped. Risk parameters are not about being timid. They are about staying in the game long enough for your edge to play out. The first parameter to set is per-trade risk — the maximum percentage of your account you are willing to lose on any single position. A common personal heuristic used by Crazii JTVertex is keeping this figure below 2% of total account equity per trade. That is not a statistic from a study; it is a working rule that has been refined through watching what happens when traders exceed it during volatile periods. When you risk 5% or 10% per trade, three consecutive losses — which is entirely normal in any strategy — can remove 15–30% of your account. That kind of drawdown changes how you think. It makes you hesitate on valid signals and chase on invalid ones. The second parameter is maximum drawdown. This is the total account decline at which you stop trading and review. In a bear market, minn suggests setting this lower than you would in a bull environment — not because you expect to hit it, but because hitting it in a bear market without a review process is how accounts go to zero.

    The evidence: ASIC Report 828 found that among active traders who opened 50 or more positions per month, 19% of those who would otherwise have been profitable ended up losing money after fees. More trading, more fees, worse outcomes. This is not a coincidence — it is a structural reality of leveraged products. Trading less, but with more precision, is not a conservative choice. It is a mathematical one.

    The third parameter — and the one most traders skip — is a daily loss cap. This is the point at which you close everything and do not trade again until the next session. It sounds simple. It is extraordinarily hard to follow when you are down and convinced the market is about to reverse. Set it before the session starts. Write it down. Honour it.

    Expert tip: Crazii JTVertex has noticed something specific that rarely gets discussed: the worst trades of the day almost always happen in the 20 minutes after a stop-loss is hit. That is when the urge to “get it back” is strongest and judgment is weakest. The daily loss cap is not just a financial limit — it is a psychological firewall. Once it is hit, the session is over. No exceptions, no “just one more”.

    Risk Parameter Bull Market Setting Bear Market Adjustment Why It Changes
    Per-trade risk Up to 2% of account 1% or lower Wider spreads, faster moves amplify losses
    Max drawdown before review 15–20% of account 10% or lower Recovery is slower in falling markets
    Daily loss cap 3–5% of account 2–3% of account Volatility makes revenge trading more damaging
    Position count Multiple concurrent Fewer, higher conviction Correlations spike; diversification benefit shrinks
    trading risk management parameters for bear market conditions — Crazii JTVertex
    Risk parameters define the boundaries of every trade — set them before the market moves, not after. · Photo: sergeitokmakov / Pixabay
    Now that you have your risk framework, the next question is what you actually trade on. Which signals and tools belong inside a strategy that is designed to survive a downturn?

    Want a structured approach to trading signals?

    The best trading signals and tools for Australian traders in 2026 — curated by Crazii JTVertex for the local market.

    View the full guide

    Which trading signals and tools belong in a bear-market strategy?

    Which trading signals and tools belong in a bear-market strategy?
    💡

    Key points: In a bear market, momentum indicators and trend-following signals need to be paired with volatility filters and confirmation tools. Signals that work in trending upward conditions often produce false entries in choppy, declining markets. Choosing the right combination — and knowing which to ignore — is as important as the signals themselves.

    Not all signals are created equal. And in a bear market, the gap between a good signal and a misleading one widens considerably. The RSI (Relative Strength Index) is a useful starting point. Its standard oversold threshold is 30 and overbought is 70 — those are the correct Wilder parameters, not adjusted versions. In a bear market, price can stay below 30 for extended periods without bouncing meaningfully. This is what traders call a “momentum divergence trap” — the indicator says oversold, the trader buys, the market continues lower. Using RSI alone in a bear market is like using a compass in a magnetic storm. It gives you a reading, but you need to verify it against something else. What does “something else” look like in practice? A moving average crossover to confirm trend direction. A volume filter to check whether a move has conviction behind it. A volatility measure — such as Average True Range — to understand whether the current price action is within normal fluctuation or represents a genuine breakout. For Australian traders exploring signal sources, the MetaTrader platform hosts more than 3,200 free and commercial signals through its built-in marketplace. That is a large number. It does not mean all of them are appropriate for bear-market conditions. Minn’s personal heuristic — and this is a heuristic, not a rule — is to ignore any signal provider with fewer than 100 completed trades in their track record. Below that threshold, the sample size is too small to distinguish skill from luck.

    The evidence: ASIC Report 828 noted that 26,243 retail clients in Australia used copy trading services in FY2023–24. That is a growing number. But copy trading does not remove risk — it transfers the decision-making to another trader whose strategy may not be designed for the conditions you are currently in. If you are using copy trading as part of your strategy, understanding who gives the best trading signals and whether you can actually trust them is not optional — it is foundational.

    Marcus — our Brisbane trader from earlier — made a specific mistake here. He was following three signal providers simultaneously, all of whom had strong records in 2021. When conditions shifted, all three started generating losses at the same time. The signals were correlated. He had diversified across providers without diversifying across strategies or market conditions.

    Expert tip: Crazii JTVertex recommends checking whether a signal provider’s drawdown periods coincide with broad market selloffs. If every major loss in their track record happened during the same weeks as the ASX or S&P 500 declining sharply, their strategy is likely long-biased. That is not inherently wrong — but it means their signals will perform worst precisely when a bear market is at its most intense. Match your signal source to the conditions you are preparing for.

    For traders wanting to understand signal quality more deeply, what trading signals are and why traders use them is worth reading before committing to any provider. And if you are looking at community-based signal sources, the best trading signals Discord servers that active traders actually trust covers the landscape in detail.
    trading signals and tools for bear market strategy — Crazii JTVertex
    Pairing RSI with volume and volatility filters reduces false signals during bear market conditions. · Photo: sergeitokmakov / Pixabay
    Knowing which tools to use is half the picture. The other half is knowing which mistakes will undermine your strategy even when the tools are right.

    What are the most common mistakes traders make when building a strategy in a downturn?

    What are the most common mistakes traders make when building a strategy in a downturn?
    💡

    Key points: The most damaging bear-market strategy mistakes are not technical errors — they are behavioural ones. Overtrading, abandoning rules under pressure, and copying strategies built for different conditions are the three patterns that consistently destroy accounts when markets fall.

    You might be reading this thinking: “I know about these mistakes already.” That is exactly when they are most dangerous. The traders who blow accounts in bear markets are not beginners who did not know the rules. They are experienced traders who knew the rules and broke them anyway — because the pressure of a falling market makes rule-breaking feel rational in the moment.
    Mistake 1
    Overtrading to recover losses

    When a strategy starts losing, the instinct is to trade more — more positions, more frequency, more size. This is the opposite of what the data supports. ASIC Report 828 found that among the most active retail traders (50 or more open positions per month), 19% of those who would otherwise have profited ended up losing money after fees. More activity did not produce better outcomes. It produced worse ones. The fee drag alone flipped one in five active traders from profit to loss.

    Mistake 2
    Using a bull-market strategy without adjustment

    A strategy optimised for trending upward conditions will produce a different — usually worse — outcome when applied to a bear market without modification. This is not a flaw in the strategy; it is a flaw in the application. Bear markets change volatility, correlation, and the reliability of momentum signals. If your strategy has not been reviewed and adjusted for these conditions, you are using the wrong tool for the job. That is a choice, not bad luck.

    Mistake 3
    Abandoning the strategy mid-drawdown

    Every strategy has drawdown periods. A drawdown during a bear market feels different — it feels like the strategy is broken, the market is broken, everything is broken. That feeling is not reliable information. The correct response to a drawdown is to review whether the rules are being followed correctly, not to abandon the rules entirely. Abandoning a strategy mid-drawdown and switching to something else is how traders compound losses rather than recover from them.

    The evidence: ASIC Report 828 also found that 5% of retail clients would have made a net profit but ended up in a loss position purely because of fees. That is one in twenty traders who did the hard work of being profitable — and still lost money because of costs they did not account for. Fees are not a footnote. They are a material part of your strategy’s performance calculation.

    common trading strategy mistakes in bear market conditions — Crazii JTVertex
    Behavioural mistakes — not technical ones — are the primary cause of strategy failure during market downturns. · Photo: TheInvestorPost / Pixabay
    Avoiding mistakes is necessary. But it is not sufficient. A strategy that avoids errors but has never been tested is still untested. That brings us to the most underused step in strategy development.

    Ready to take your strategy further?

    Join the Crazii JTVertex community for ongoing signal analysis, strategy discussion, and support from traders who understand the Australian market.

    Join the community

    How do you test and refine your trading strategy before going live in volatile conditions?

    How do you test and refine your trading strategy before going live in volatile conditions?
    💡

    Key points: Testing a trading strategy before live deployment involves backtesting against historical bear-market periods, then forward-testing in a demo environment under current conditions. Neither step alone is sufficient — backtesting shows historical fit, forward-testing reveals how the strategy behaves in real time without real money at risk.

    This is where most traders cut corners. Backtesting feels tedious. Demo trading feels pointless when you are eager to trade real money. Both feelings are understandable. Both are expensive if you act on them. Backtesting means applying your strategy rules to historical price data to see how they would have performed. The important word is “rules” — not “judgement.” If you are manually reviewing historical charts and thinking “I would have entered here,” that is not backtesting. That is hindsight. True backtesting applies your rules mechanically, without adjusting for what you know happened next. For Australian traders, the periods worth backtesting specifically include the COVID crash of February–March 2020 and the rate-hike-driven selloff of 2022. These are recent, local-context bear periods with real data. If your strategy survived those periods without exceeding your maximum drawdown parameter, that is meaningful information. If it did not, that is also meaningful information — and better to know now. Forward-testing in a demo account is the next step. This is where you run your strategy in real time, with real signals, under real market conditions — but with simulated money. The value is not just in the performance numbers. It is in what you learn about yourself. Do you actually follow your rules when a position moves against you? Do you honour your daily loss cap? Do you exit when your exit rule triggers, or do you wait “just a little longer”?

    The evidence: The ASIC data on retail CFD outcomes (Report 828, January 2026) shows that 74% of new retail clients acquired through paid online advertising lost money in FY2023–24. That is higher than the overall 68% loss rate. One interpretation: traders who enter the market through advertising-driven channels may be less prepared — less tested, less structured — than those who have done the groundwork first. Preparation is not a guarantee. But the absence of it is consistently correlated with worse outcomes.

    Marcus went back to his strategy after that Tuesday in 2022. He backtested it against the 2022 rate-hike period. He found that his entry signals were generating trades at a rate three times higher than in calmer conditions — which meant his fees were tripling at exactly the moment his win rate was declining. He adjusted his entry filter to require two confirmations instead of one. His trade frequency dropped. His results improved. That adjustment took him one afternoon. The cost of not making it had been months of losses.

    Expert tip: Crazii JTVertex uses a specific rule when reviewing backtest results: if the strategy’s worst drawdown period does not coincide with a known market event (a crash, a rate decision, a geopolitical shock), be suspicious. Drawdowns that happen “for no reason” usually mean the strategy is picking up noise rather than signal. The best strategies have explainable losses — you can point to the market condition that caused them. Unexplainable losses suggest the edge is weaker than the backtest implies.

    1

    Select your bear-market backtest periods

    Choose at least two distinct bear or high-volatility periods relevant to your market. Apply your strategy rules mechanically. Record every entry, exit, and the outcome. Do not adjust rules mid-backtest.

    2

    Run a minimum 30-trade forward test in demo

    Thirty trades is a personal heuristic — below that, the sample is too small to draw conclusions. Track not just profit and loss, but rule adherence. Did you follow every rule on every trade? If not, why not? The answer to that question is more valuable than the P&L.

    3

    Review and adjust before going live

    After forward-testing, review the results with the same critical eye you would apply to someone else’s strategy. Identify the two or three trades where you deviated from your rules. Understand why. Then decide whether the rule needs changing or your discipline does. Usually, it is the latter.

    backtesting and refining a trading strategy for volatile markets — Crazii JTVertex
    Backtesting against historical bear-market periods reveals how a strategy performs before real money is at risk. · Photo: TheInvestorPost / Pixabay

    Frequently asked questions about building a trading strategy

    Frequently asked questions about building a trading strategy

    How long does it take to build a trading strategy that works in a bear market?

    There is no fixed timeline, but a realistic expectation is several weeks of research, backtesting, and demo trading before going live. Rushing this process to start trading sooner is one of the most common and costly mistakes Australian retail traders make.

    Can a beginner build a bear-market trading strategy without prior experience?

    Yes, but with realistic expectations. A beginner’s first strategy will be imperfect — the goal is to make it rules-based and testable, not perfect. Start with a single instrument, a simple signal set, and conservative risk parameters. Complexity can come later.

    Do trading signals work differently in a bear market compared to a bull market?

    Yes. Momentum signals and trend-following indicators tend to produce more false entries in choppy, declining markets. Signals need to be paired with volatility filters and confirmation tools to reduce noise. A signal that performed well in 2021 may need adjustment for 2022-style conditions.

    How much of my account should I risk per trade in a bear market?

    This is a personal decision based on your circumstances, but a commonly used heuristic is keeping per-trade risk below 1–2% of total account equity. In a bear market, erring toward the lower end of that range is prudent because volatility amplifies both gains and losses. This is not financial advice — consider your own situation.

    Is copy trading a valid strategy during a bear market?

    Copy trading can be part of a strategy, but it does not remove risk — it transfers decision-making to another trader. In a bear market, it is important to understand whether the trader you are copying uses a long-biased strategy, because that strategy will typically perform worst during sustained market declines. Always read the relevant disclosure documents.

    Want to talk through your trading strategy?

    Crazii JTVertex is available for direct questions — reach out through the contact page or join the community group for ongoing support.

    Get in touch

    Note: This article contains general information only and is not personal financial advice. CFD trading and margin FX are high-risk activities. According to ASIC Report 828 (January 2026), 68% of retail CFD clients in Australia lost money in FY2023–24. Past performance is not indicative of future results. Always read the Product Disclosure Statement and consider your own financial circumstances before trading. For personalised advice, speak with a licensed financial adviser.
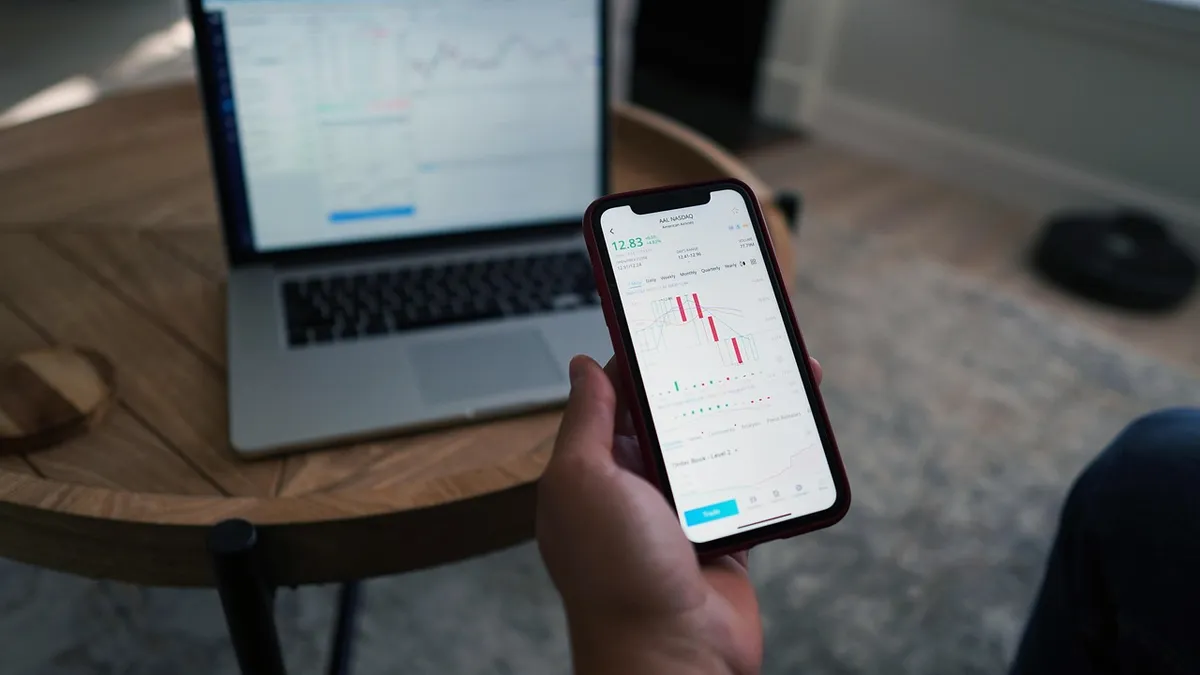
  • What Is Market Structure in Trading and Why Traders Ignore It

    What Is Market Structure in Trading and Why Traders Ignore It

    What is market structure in trading — and why does understanding it separate the traders who last from the ones who disappear quietly after a bad run? Market structure is the backbone of how price moves: the sequence of highs and lows that tells you whether buyers or sellers are in control at any given moment. At Crazii JTVertex, we have spent years watching Australian traders make the same avoidable mistake — entering trades without ever asking whether the market itself is moving with them or against them. This article, What Is Market Structure in Trading and Why Traders Ignore It, will give you one clear framework you can use before your next trade to decide whether the odds are stacked in your favour or not. By the end, you will know exactly what to look for on a chart — and you will never look at a candlestick the same way again.

    Start with the right tools before the right strategy

    Understanding market structure is step one. Choosing the right trading tools is what makes it actionable — see what Crazii JTVertex recommends for Australian traders.

    See recommended tools
    Table of contents

    What is market structure in trading, exactly?

    What is market structure in trading, exactly?
    💡

    Key points: Market structure in trading is the pattern of swing highs and swing lows that reveals whether a market is trending upward, trending downward, or ranging sideways. It is the single most reliable context layer before any entry decision — and it costs nothing to read once you know how.

    Picture this. It is a Tuesday afternoon in Sydney, and a trader named Marcus — 34, works in IT, been trading Forex on the side for two years — is staring at a EUR/USD chart. He has a signal. The indicator is green. He enters long. The trade moves against him almost immediately. He holds. It keeps falling. He closes at a loss, frustrated, convinced the signal was broken. The signal was not broken. Marcus just did not know which direction the market was already moving. Market structure is simply the language price uses to tell you who is winning — buyers or sellers. In an uptrend, price makes a series of higher highs (HH) and higher lows (HL). Each new peak is higher than the last. Each pullback stops higher than the previous pullback. That sequence is the market saying, clearly and repeatedly: buyers are in control. In a downtrend, the opposite is true. Lower highs (LH) and lower lows (LL) form a descending staircase. Price cannot sustain any rally. Every bounce gets sold. In a ranging market, highs and lows stay roughly horizontal — neither side has conviction. This matters because every trading decision you make is either aligned with that structure or fighting against it. Fighting against it is not impossible, but it is expensive. According to ASIC’s Report 828 (published January 2026), 68% of retail CFD clients in Australia lost money in FY2023–24. That is more than two-thirds of active traders. Not all of those losses trace back to ignoring market structure — but a significant portion come from entering trades without any directional context at all. Think of it this way: if you were driving from Melbourne to Brisbane, you would want to know which lane you are in before you accelerate. Market structure is the lane.

    The evidence: ASIC Report 828 (January 2026) found that 133,674 retail clients lost money in FY2023–24, with net losses exceeding $458 million across the Australian CFD sector. Traders who lack a structural framework are making directional bets without any map.

    Expert tip: Crazii JTVertex looks at market structure on the daily chart first — always — before dropping to a lower timeframe. The number of times we has seen a clean 15-minute buy signal sitting inside a daily downtrend is genuinely alarming. The lower timeframe signal was real. The context made it a trap.

    what is market structure in trading higher highs higher lows Crazii JTVertex
    Market structure basics: higher highs and higher lows define an uptrend — Crazii JTVertex · Photo: TheInvestorPost / Pixabay

    How do you identify market structure on a chart?

    How do you identify market structure on a chart?
    💡

    Key points: Identifying market structure requires locating the most recent significant swing high and swing low on your chosen timeframe, then asking whether the next swing broke above or below those levels. No indicator needed — just price, patience, and a consistent method for defining what counts as a swing point.

    So how do you actually find market structure? Not with an indicator. Not with a fancy tool. With your eyes and a clear rule. A swing high is a candle (or bar) with a lower high on both sides of it. A swing low is a candle with a higher low on both sides. Once you can spot those consistently, you have the raw material for reading structure. Here is the method Crazii JTVertex uses, broken into four steps:
    1

    Choose your timeframe deliberately

    Start on the daily chart. This is not negotiable for new traders. The daily chart filters out the noise that destroys discipline on lower timeframes. Once you understand what the daily is doing, you can step down to the 4-hour or 1-hour to find entries.

    2

    Mark the last three to five swing points

    You do not need ten. You need the most recent three to five swing highs and lows. Connect them loosely with your eye. Is the sequence ascending, descending, or flat? That is your structure at a glance.

    3

    Label each point clearly

    Write HH, HL, LH, LL directly on your chart. This sounds tedious. Do it anyway. The act of labelling forces your brain to commit to a reading rather than see whatever it wants to see — which is a trap every trader falls into at some point.

    4

    Ask the one question that matters

    Is the current price action confirming that structure or threatening to break it? Confirmation means the structure is intact and trades in the direction of the trend carry higher probability. A threat means you need to wait before committing capital.

    Marcus — the trader from Sydney — went back and did exactly this after his EUR/USD loss. He pulled up the daily chart. The last three swing highs were descending. The last three swing lows were also descending. He had entered a long trade in a clear downtrend because a 15-minute indicator told him to. That is not a signal problem. That is a structure blindness problem.

    The evidence: ASIC Report 828 notes that 74% of retail clients acquired through paid online advertising lost money in FY2023–24 — worse than the sector average of 68%. Traders drawn in by flashy signals without structural context consistently underperform those who understand the directional environment first.

    Expert tip: We once spent three weeks trying to short a pair that kept making higher lows. Every technical signal said “sell.” The structure said “buyers keep stepping in.” The structure was right every single time. The lesson: when structure and indicator disagree, structure wins — unless the structure itself is breaking down, which is a different conversation entirely.

    how to identify market structure swing highs swing lows chart reading Crazii JTVertex
    Identifying swing highs and lows is the foundation of reading price structure — Crazii JTVertex · Photo: sergeitokmakov / Pixabay

    Want to see how structure-aware traders use signals?

    Reading market structure is the context layer. Trading signals are the trigger. See how they work together for Australian traders in 2026.

    What are trading signals

    Why does market structure break down — and what does a structural shift mean?

    Why does market structure break down — and what does a structural shift mean?
    💡

    Key points: A structural shift occurs when price breaks a key swing point that, if held, would have confirmed the existing trend. In an uptrend, a structural shift happens when price breaks below the most recent higher low. This is the earliest signal that the trend may be changing — not a reversal confirmation, but a warning worth respecting.

    Here is where most traders get confused — and where the real money is made or lost. Markets do not trend forever. At some point, the buyers run out of conviction, or sellers step in with enough force to change the sequence. When that happens, the structure breaks. And if you are still positioned for the old trend, you are now on the wrong side of the market. A structural shift in an uptrend looks like this: price was making HH and HL. Then it fails to make a new HH. Then it breaks below the most recent HL. That break — a candle closing below that HL — is the structural shift. It does not mean the trend is definitely over. It means the evidence for the uptrend is now weaker than it was, and the burden of proof has shifted. Why do traders ignore this? Because they are emotionally attached to their original read. The chart said “uptrend” last week. They entered long. They want it to still be an uptrend. So they explain away the break. “It is just a liquidity grab.” “It will bounce.” Sometimes it does. Often it does not. The cost of ignoring a structural shift is not just one bad trade. It is the slow erosion of an account as you keep adding to a position that the market has already told you is wrong. Crazii JTVertex treats a confirmed structural shift as a mandatory pause point. Not necessarily a reversal trade — just a pause. Stop adding. Reassess. Let the next two or three candles tell you whether the break has follow-through or whether buyers are reclaiming the level. There is a meaningful difference between a structural shift and a structural break. A shift is the first warning. A break — confirmed by follow-through candles and a new lower low — is the confirmation. Acting on the shift alone is aggressive. Waiting for the break is more conservative. Neither is wrong. They suit different risk tolerances.

    The evidence: ASIC Report 828 found that among the most active traders — those with 50 or more open positions per month — 19% of those who would otherwise have been profitable ended up losing money after fees in FY2023–24. Overtrading through structural shifts, rather than pausing to reassess, is a direct contributor to this pattern.

    Expert tip: Crazii JTVertex has a personal rule: if a structural shift happens on the daily chart while we is holding a position, the position size gets cut by half immediately — not because the trade is wrong, but because the context has changed. Full size belongs to confirmed structure. Half size belongs to uncertainty. Zero belongs to denial.

    market structure break shift in trend price action analysis Crazii JTVertex
    A structural shift is the first warning that trend momentum is weakening — Crazii JTVertex · Photo: sergeitokmakov / Pixabay
    For a deeper look at how structural awareness fits into a longer-term approach, the guide on how to build a trading strategy that survives a bear market walks through exactly how to position yourself when structure turns against you.

    Join traders who read structure before they read signals

    Crazii JTVertex’s community shares real-time market structure analysis alongside signal alerts — context and trigger together, not separately.

    Join the group

    What are the 3 most common market structure mistakes traders make?

    What are the 3 most common market structure mistakes traders make?
    💡

    Key points: The three most damaging market structure mistakes are: trading against the dominant structure on a higher timeframe, ignoring structural shifts because of emotional attachment to an open position, and treating every range as a trend. Each one is fixable with a simple pre-trade checklist.

    Let us be direct here. These are not abstract mistakes. These are the exact errors that show up in losing accounts, and they are more common than most traders want to admit.
    Mistake 1
    Trading against the higher timeframe structure

    A 5-minute chart shows a beautiful ascending channel. The daily chart shows a clear downtrend. The trader enters long on the 5-minute. This is not a signal failure — it is a timeframe conflict. Lower timeframe structure exists inside higher timeframe structure. When they conflict, the higher timeframe wins. Every time.

    Mistake 2
    Holding through a structural shift because of sunk cost

    The position is down. The structure has broken. But the trader holds because they have already lost and they need the trade to come back. This is not a trading decision — it is an emotional one. The market does not care what you paid. Structure breaking is information. Ignoring information is expensive.

    Mistake 3
    Calling every range a trend

    Price makes a slightly higher high, then a slightly higher low. The trader calls it an uptrend and enters long with full size. But the move is tiny, the range is tight, and there is no real momentum. Ranging markets chew through accounts because they generate false signals constantly. If the highs and lows are not clearly ascending or descending, the honest label is “range” — and range trading requires a completely different approach.

    Marcus made all three of these mistakes in his first eighteen months. The third one cost him the most. He kept seeing micro-uptrends inside a sideways market and entering with conviction, only to get stopped out when the range reasserted itself. You might be reading this thinking: “Right, but surely experienced traders know all this.” Some do. Many do not. Or they know it intellectually and ignore it emotionally — which amounts to the same thing when real money is on the line.

    The evidence: ASIC Report 828 recorded $73 million in fees within the $458 million net retail loss in FY2023–24. Fees alone flipped 5% of otherwise-profitable retail clients into a net loss. That means for a meaningful slice of traders, the issue was not even bad structure reads — it was overtrading within choppy, ranging conditions where fees compound against you.

    Expert tip: We uses a single pre-trade question to catch Mistake 1 before it happens: “What is the daily chart doing right now?” If the answer is “I am not sure,” the trade does not happen. Uncertainty about structure is not a reason to trade smaller — it is a reason to wait. Smaller size in bad structure is still bad structure.

    common market structure trading mistakes ranging market false signals Crazii JTVertex
    Ranging markets generate the most structural confusion for retail traders — Crazii JTVertex · Photo: AhmadArdity / Pixabay

    How does market structure connect to trading signals and tools?

    How does market structure connect to trading signals and tools?
    💡

    Key points: Trading signals are most effective when they align with the dominant market structure. A buy signal in an uptrend carries higher probability than the same signal in a downtrend. Market structure is the filter that decides which signals deserve your capital and which ones should be ignored — regardless of how convincing they look in isolation.

    This is where structure stops being theory and starts being practical. Most traders approach signals as if they are self-contained — a green arrow means buy, a red arrow means sell. That works until it does not. And when it stops working, traders blame the signal provider, the indicator, or the market. The real issue is almost always context. A signal is a trigger. Structure is the context. Without context, a trigger is just noise. Think of it like a traffic light. A green light at an intersection is a signal to go. But if you can see that the road ahead is blocked — a structural problem — you do not go just because the light is green. The signal is valid. The context makes it dangerous. This is precisely why Crazii JTVertex built its approach around combining structural analysis with curated signal tools. According to ASIC Report 828, 26,243 retail clients used copy trading in FY2023–24 — a significant number, and growing. But copy trading and signal following without structural awareness is still directional betting without a map. The best use of any signal is as a timing tool within a structure you already understand. If the daily structure is bullish — clear HH and HL sequence — and a signal fires on the 4-hour chart at a structural support level, that is a high-quality setup. The signal did not create the opportunity. The structure created the opportunity. The signal told you when. For Australian traders building their toolkit, the comprehensive guide on best trading signals and tools for Australian traders in 2026 covers exactly how to evaluate signal quality against structural context — including what to look for in a provider before trusting them with your decision-making. And if you want to understand who actually provides reliable signals and how to assess their track record, the article on who gives the best trading signals and whether you can actually trust them is worth reading before you subscribe to anything. Marcus, by the way, did not quit trading. He went back to basics, started marking daily structure before every session, and stopped entering trades where his signal and his structure disagreed. The change was not dramatic — no single trade saved him. It was the accumulation of trades he did not take that made the difference.

    The evidence: MetaQuotes reports over 3,200 free and commercial signals available on the MetaTrader 5 platform as of June 2026. Volume is not the problem. Knowing which signals to filter by structural context is the skill that separates consistent traders from the 68% who lost money in FY2023–24 according to ASIC Report 828.

    Expert tip: Crazii JTVertex personally ignores any signal — regardless of the provider’s track record — when it fires against the daily structure. This is not a rule we read somewhere. It is a rule we developed after watching three consecutive winning months get erased in one week of fighting a structural downtrend because the signals kept saying “buy.” The signals were not wrong. The structure was the boss.

    trading signals market structure context filter Australian traders Crazii JTVertex
    Signals work best as timing tools within a clearly defined market structure — Crazii JTVertex · Photo: Pexels / Pixabay

    Frequently asked questions about market structure in trading

    Frequently asked questions about market structure in trading
    💡

    Key points: These are the questions Australian traders ask most often about market structure — answered directly, without jargon, so you can apply the answers immediately rather than needing to cross-reference five other articles.

    What is the difference between market structure and market trend?

    A trend is the general direction of price over time. Market structure is the specific sequence of highs and lows that confirms or questions that trend. Structure is the evidence that a trend is real — without it, a “trend” is just a feeling.

    Can market structure be used on any asset class?

    Yes. The logic of higher highs, higher lows, lower highs, and lower lows applies to Forex, indices, commodities, and equities. The principle is universal because it describes how price moves, not the specific instrument being traded.

    How many swing points do I need to confirm a trend structure?

    As a personal heuristic — not a statistical rule — Crazii JTVertex looks for at least two confirmed higher highs and two confirmed higher lows before calling a bullish structure valid. One swing point is a data point. Two is a pattern worth respecting.

    Does market structure work in highly volatile markets?

    Structure becomes harder to read during extreme volatility because swing points can be violated and reclaimed rapidly. In those conditions, moving to a higher timeframe reduces noise. The daily chart remains reliable even when the 15-minute looks chaotic.

    Is market structure analysis suitable for beginner traders?

    It is one of the best starting points for beginners precisely because it requires no indicators — just price and a clear rule. That said, trading CFDs and margin products is high-risk regardless of method. This content is general information, not personal financial advice. Consider your own circumstances and relevant disclosure documents before trading.

    Note: This article provides general information only and does not constitute personal financial advice. Trading CFDs and margin Forex products involves significant risk of loss. ASIC Report 828 (January 2026) found that 68% of retail CFD clients in Australia lost money in FY2023–24. Please consider your own financial situation, objectives, and risk tolerance, and read all relevant Product Disclosure Statements before making any trading decisions.

    Ready to talk structure, signals, and your next step?

    Crazii JTVertex works with Australian traders who want a clear framework — not just alerts. Reach out directly if you want a conversation about where you are and what fits.

    Contact Crazii JTVertex
  • How to Understand Trading Signals Before Risking Real Money

    How to Understand Trading Signals Before Risking Real Money

    How to understand trading signals is the question that separates traders who blow their first account from those who actually survive long enough to learn. At Crazii JTVertex, we work directly with Australian traders navigating this exact moment — the one where a signal flashes green, your finger hovers over the button, and you genuinely have no idea whether to trust it. This guide on how to understand trading signals before risking real money will give you a working framework to read, filter, and act on signals with clarity — so the first dollar you put in is backed by something more than hope.

    Here is the stake nobody says out loud: every week you spend trading signals you do not fully understand is a week you are essentially paying tuition to the market. According to ASIC’s Report 828, 68% of Australian retail CFD clients lost money in FY2023–24 — that is 133,674 people, with net losses exceeding $458 million in a single financial year. That is not a warning label. That is a description of what happens when traders skip the step you are about to take.

    By the end of this article, you will know exactly what a trading signal is telling you, what it is hiding, and how to test one before a single dollar is at risk. That is the promise. Hold me to it.

    Not sure where to start with trading tools?

    Crazii JTVertex has put together a free resource hub for Australian traders — signals, tools, and the context to use them properly.

    Explore the hub
    Table of contents

    What is a trading signal and how does it actually work?

    What is a trading signal and how does it actually work?
    💡

    Key points: A trading signal is a data-driven prompt — generated by an algorithm, an analyst, or a combination of both — that suggests a specific action: buy, sell, or hold a given asset at a defined price and time. It does not guarantee profit. It is a structured opinion backed by a set of conditions.

    Picture this. Marcus, 34, an electrician from Brisbane, opens his phone at 6:47 am on a Tuesday. A signal notification reads: “BUY EURUSD — Entry 1.0842, Stop Loss 1.0810, Take Profit 1.0900.” He has no idea what generated that number, why those levels were chosen, or whether the person who sent it has ever had a losing month. He takes the trade anyway. That is not trading. That is gambling with extra steps. A trading signal at its core is a conditional statement: if these market conditions align, then this action has historically produced a favourable outcome. The conditions might be technical — a moving average crossover, an RSI reading below 30 (the standard oversold threshold defined by Wilder), or a breakout above a resistance level. They might be fundamental — an interest rate decision, an employment figure, or a shift in commodity supply. Most professional signal systems combine both. The mechanism works like this. The signal provider defines a ruleset — for example, “enter a long position when the 20-period EMA crosses above the 50-period EMA on the four-hour chart, provided the RSI is below 70.” Every time those conditions are met, a signal fires. The provider’s track record reflects how often that ruleset produced a winning trade across historical data. The problem is that historical data is not the future. What a signal does not tell you is equally important. It does not account for your broker’s spread, your account size, or your emotional state at 11 pm when the trade is running against you. It does not know your risk tolerance. And unless you understand the logic behind it, you cannot judge whether the conditions that made it work in the past still exist today. Understanding a signal means understanding its origin, its logic, and its limits — not just its direction. That is the core of how to understand trading signals properly, and it is the step most retail traders skip entirely.

    The evidence: MetaQuotes reports that the MetaTrader platform hosts more than 3,200 free and commercial signal providers in its built-in marketplace. Volume alone tells you nothing about quality. The sheer number of available signals means the filtering work falls entirely on you.

    Expert tip: Crazii JTVertex has reviewed dozens of signal providers, and the single most revealing question to ask is this — “What is your maximum consecutive losing streak?” Not win rate. Not monthly return. Consecutive losses. A provider who cannot answer that, or who has never tracked it, is operating on luck, not a system. Most providers will not volunteer this number. Ask for it directly.

    1

    Identify the signal type

    Determine whether the signal is technical (chart-based), fundamental (news-based), or hybrid. Each type requires different context to evaluate and carries different timing risks.

    2

    Locate the entry logic

    Find the specific conditions that triggered the signal. If the provider cannot explain the trigger in plain language, that is a red flag — not a style choice.

    3

    Check the risk parameters

    Every legitimate signal includes a stop loss. If it does not, it is not a signal — it is a tip. Stop loss placement tells you more about a provider’s risk philosophy than their win rate ever will.

    how to understand trading signals Crazii JTVertex
    Understanding the anatomy of a trading signal is the foundation before any real capital is committed. · Photo: sergeitokmakov / Pixabay

    How do you read trading signal data without getting misled?

    How do you read trading signal data without getting misled?
    💡

    Key points: Reading signal data accurately means looking beyond win rate to metrics like risk-reward ratio, maximum drawdown, and the number of completed trades in the track record. A signal with a 90% win rate on 11 trades is statistically meaningless. One with a 58% win rate across 400 trades is worth examining.

    So you have found a signal provider with a polished dashboard showing 83% accuracy. Looks impressive. But here is what that number is almost certainly hiding. Win rate without context is the most misleading metric in trading. A provider can achieve an 83% win rate by targeting tiny profits — say, 10 pips — while allowing losses to run to 80 pips. Do the arithmetic. Even with eight wins out of ten trades, the net result is negative. This is called a skewed risk-reward ratio, and it is the oldest trick in the signal-selling playbook. The metrics that actually matter are these. First, the risk-reward ratio: what is the average profit on winning trades compared to the average loss on losing ones? A ratio below 1:1 means you need a win rate above 50% just to break even. Second, maximum drawdown: what is the largest peak-to-trough decline in the account equity? This tells you the worst realistic scenario you would have lived through. As a personal heuristic — not a statistical rule — minding treats any provider with a maximum drawdown above 20% of account equity as high risk, regardless of their overall return. Third, and this is the one most traders skip entirely: the number of trades in the sample. Minding recommends ignoring any signal provider with fewer than 100 completed trades in their track record. Below that threshold, you are looking at noise, not signal. Marcus, our Brisbane electrician, eventually learned to look at these numbers. He found a provider with a 61% win rate — modest-sounding — but a 1.8:1 average risk-reward ratio and 340 completed trades over 14 months. That combination meant the provider was genuinely profitable in expectation, not just lucky over a short run. Knowing how to understand trading signals at this level of detail is what made the difference between a workable system and an expensive mistake. There is also the question of fees. ASIC’s Report 828 found that $73 million of the $458 million in retail losses in FY2023–24 came from fees alone — meaning fees flipped 5% of otherwise-profitable retail clients into a net loss. Translate that to your own account: if your signal provider charges a monthly subscription and your broker charges a wide spread, you need to generate returns above those combined costs before you are even at breakeven. That bar is higher than it looks.

    The evidence: ASIC Report 828 (January 2026) found that among active traders placing 50 or more open positions per month, 19% of those who would otherwise have been profitable ended up in a net loss after fees. More trading frequency did not improve outcomes — it worsened them for a meaningful minority.

    Expert tip: When minding reviews a signal dashboard, the first thing to look at is not the equity curve — it is the trade list, sorted by date. Look for gaps. A provider who stopped publishing results for three weeks and then resumed with a clean run almost certainly had a losing period they chose not to display. Gaps in the trade history are a quiet confession.

    Metric What to look for Red flag
    Win rate Meaningful only alongside risk-reward ratio Quoted without context
    Risk-reward ratio Average win / average loss — aim for above 1:1 Below 1:1 with high win-rate claims
    Maximum drawdown Largest equity decline from peak Above 20% (author’s heuristic)
    Sample size Minimum 100 completed trades Fewer than 50 trades in history
    Trade history gaps Continuous, date-stamped record Missing weeks or unexplained pauses
    For a broader comparison of signal tools and platforms available to Australian traders, the guide on best trading signals software compared for serious traders in 2026 walks through these metrics applied to specific providers.
    reading trading signal data and metrics Crazii JTVertex
    Key performance metrics every trader should review before following any signal provider. · Photo: sergeitokmakov / Pixabay

    Want to see which signal tools are worth your time?

    Crazii JTVertex has reviewed the leading options for Australian traders — with the metrics that actually matter, not just the marketing.

    See the full review

    What is the science behind why trading signals fail?

    What is the science behind why trading signals fail?
    💡

    Key points: Trading signals fail for three structural reasons: overfitting to historical data, changing market regimes, and execution gaps between the signal’s theoretical entry and the trader’s actual fill price. Understanding these mechanisms helps you set realistic expectations before a single trade is placed.

    Here is the uncomfortable truth that most signal providers will not put in their marketing material. The conditions that made a signal profitable in the past may not exist anymore. Markets are not static. They shift between trending regimes and ranging regimes, between high volatility and low volatility, between risk-on and risk-off environments. A moving average crossover strategy that performed brilliantly during a directional bull run in 2022 may produce a string of false signals in a choppy, sideways market in 2025. The signal has not broken. The market it was designed for has changed. This is called regime dependency, and it is the primary reason why even well-constructed signals have losing periods. The second reason is overfitting. When a signal provider optimises their ruleset on historical data, they can — intentionally or not — create a system that fits the past perfectly and the future poorly. The more parameters a system has, the more opportunities there are to overfit. A system with 12 conditions that all had to align for a trade to fire may have produced extraordinary backtest results and mediocre live results. The third reason is execution. A signal might specify “buy at 1.0842,” but by the time you receive the alert, open your platform, and place the order, the price has moved. In fast markets, this slippage can turn a theoretically profitable entry into a marginal or losing one. This gap between signal price and execution price is real, and it compounds over hundreds of trades. What does this mean practically? It means a signal that works is not enough. You need a signal that works in the current market regime, that has been tested on out-of-sample data (not just the period it was built on), and that you can execute at a price close enough to the signal’s specified entry to preserve the intended risk-reward ratio. This is a key part of how to understand trading signals in a way that holds up under real market conditions — not just in a backtest. To understand why market structure underlies all of this, the article on what is market structure in trading and why traders ignore it provides the foundational context that makes signal interpretation significantly more reliable.

    The evidence: ASIC Report 828 found that 74% of retail clients acquired through paid online advertising lost money in FY2023–24 — worse than the sector average of 68%. Traders drawn in by marketing tend to skip the evaluation steps that matter. The signal quality they encounter is often secondary to the urgency the marketing creates.

    Expert tip: Minding has seen signal providers switch their displayed results from live trading to backtested data mid-way through a losing streak — without labelling the change. The tell is in the execution timestamps. Live trades have irregular fill times. Backtest results tend to show fills at the exact open of the candle, to the second. If every trade in the history shows a fill at 00:00:00 or 08:00:00 exactly, you are looking at a backtest, not a live record.

    why trading signals fail market regime and overfitting Crazii JTVertex
    Regime shifts and overfitting are the two structural reasons even well-rated signals underperform in live markets. · Photo: sergeitokmakov / Pixabay

    What are the most common trading signal mistakes Australian traders make?

    What are the most common trading signal mistakes Australian traders make?
    💡

    Key points: The most damaging mistakes traders make with signals are not technical — they are behavioural. Skipping the track record check, over-leveraging on a single signal, and abandoning a signal after one losing trade are the three patterns that turn a workable system into an expensive lesson.

    Marcus made all three. And he is not unusual.
    Mistake 1
    Following a signal without understanding the stop loss logic

    A stop loss is not just a number — it is the signal provider’s statement about where the trade idea is invalid. If price hits the stop, the conditions that justified the trade no longer exist. Traders who move their stop loss further away to “give the trade more room” are not managing risk — they are overriding the signal’s core logic. At that point, they are no longer following a signal. They are improvising.

    Mistake 2
    Treating a copy-trading account as a passive income source

    ASIC’s Report 828 noted 26,243 retail clients used copy trading in FY2023–24 — a growing segment. The misunderstanding most of them share is that copy trading removes the need to understand what is being copied. It does not.

    When the provider you are copying enters a drawdown, you need to know whether that drawdown is within their normal operating range or a sign of a broken system. Without understanding the signal logic, you cannot make that call. You will either exit too early and miss the recovery, or hold too long and absorb a loss the provider eventually claws back — without you.

    Mistake 3
    Over-trading based on signal frequency

    More signals do not mean more profit. ASIC’s data shows that among active traders placing 50 or more open positions per month, 19% of those who would have been profitable ended up in a net loss after fees. In plain terms: the more frequently you traded, the more likely fees were to erase your gains. A signal that fires 40 times a month is not four times better than one that fires 10 times. It may be four times more expensive.

    Who should not use trading signals at all? If you cannot define your maximum acceptable loss per trade before placing it, signals will not save you — they will give your losses a veneer of structure. Signals are a tool for traders who already have a risk management framework. They are not a substitute for one. And if you are still working out how to understand trading signals at a fundamental level, that framework needs to come first.

    The evidence: 85% of Australian retail clients lost money trading options CFDs in FY2023–24, according to ASIC Report 828. Options CFDs are frequently paired with aggressive signal services promising high returns. The loss rate is not a coincidence — it reflects the compounding of product complexity, leverage, and signal misuse.

    Expert tip: The mistake Crazii JTVertex made early on — and it is embarrassing to admit — was increasing position size after three consecutive winning trades from a new signal provider. It felt like confirmation. It was survivorship bias. The fourth trade was the largest loss in that provider’s recorded history. Position sizing should be fixed and rules-based, never adjusted upward based on recent wins from a signal you have not yet fully validated.

    common trading signal mistakes Australian traders Crazii JTVertex
    Behavioural mistakes — not technical ones — are the primary driver of signal-related losses for retail traders. · Photo: TheInvestorPost / Pixabay

    Ready to build a strategy around signals that actually fits your risk profile?

    The Crazii community includes traders at every level — join the group to ask questions and see how others are approaching signal evaluation in the current market.

    Join the group

    How do you understand trading signals well enough to test them before risking real money?

    How do you understand trading signals well enough to test them before risking real money?
    💡

    Key points: Testing a signal before committing real capital involves three stages: paper trading (simulated execution), forward testing on a demo account, and a controlled micro-lot live test. Each stage answers a different question about the signal’s viability for your specific situation.

    What is the actual process? Because “test it first” is advice everyone gives and almost nobody explains properly. Stage one is paper trading. This means recording every signal as if you had taken the trade — entry price, stop loss, take profit, position size — in a spreadsheet, without executing anything. Do this for a minimum of 20 signals. You are not testing the signal’s profitability yet. You are testing your own ability to receive, interpret, and record a signal accurately. Many traders discover at this stage that they misread the entry direction, or that the signal arrives after the entry price has already moved significantly. That is valuable information that costs nothing. It is also the first real test of whether you genuinely understand trading signals or are simply following instructions without comprehension. Stage two is a demo account. Open a demo account with the same broker you intend to use for live trading. Execute the signals in real time, at real market prices, with the same position sizes you would use with real money. Run this for at least 30 trades or four weeks, whichever comes first. The demo account reveals execution gaps — the difference between the signal’s stated entry and what you actually get filled at. It also reveals your emotional response to simulated losses, which is a preview of how you will respond to real ones. Stage three is a micro-lot live test. This is the step most traders skip because they feel impatient by this point. Place real trades at the smallest possible position size your broker allows. The purpose is not to make money — the amounts involved are too small for that. The purpose is to experience the psychological difference between a loss on paper and a loss on a live account. That difference is real, and it affects decision-making in ways a demo account cannot replicate. Marcus ran through all three stages over eight weeks before committing meaningful capital. He found that the signal provider he had been watching performed almost identically in demo as in paper trading — a good sign. The live micro-lot phase revealed that he had a tendency to exit winning trades early, before the take profit was hit. That was not a signal problem. That was his problem. Knowing it before scaling up saved him from a pattern that would have systematically undercut any signal he followed. For a framework on building the strategy that sits around these signals, the article on how to build a trading strategy that survives a bear market covers the structural layer that signal testing alone cannot replace.

    The evidence: The full landscape of tools and signal providers available to Australian traders — including which platforms support proper demo testing environments — is covered in the pillar guide on best trading signals and tools for Australian traders in 2026, which consolidates the evaluation criteria discussed across this article.

    Expert tip: During the demo phase, minding tracks not just P&L but “signal-to-execution delay” — the time between receiving the alert and placing the order. For most retail setups, that delay runs between 45 seconds and three minutes. In a fast-moving market, that gap can completely change the trade’s risk profile. If your delay consistently exceeds two minutes, you need either a faster alert system or a signal provider whose entries are limit orders, not market orders.

    1

    Paper trade for 20 signals

    Log every signal in a spreadsheet before touching a platform. Confirm you can correctly identify entry, stop loss, and take profit without ambiguity.

    2

    Demo trade for 30+ signals

    Execute in real time on a demo account with your intended broker. Track execution gaps and your emotional responses to drawdowns.

    3

    Micro-lot live test

    Place real trades at minimum size. The goal is psychological calibration, not profit. Identify any behavioural patterns that differ from your demo results.

    testing trading signals on demo account before risking real money Crazii JTVertex
    A structured three-stage testing process reduces the cost of learning what a signal can and cannot do for your account. · Photo: 3844328 / Pixabay

    Frequently asked questions about understanding trading signals

    Frequently asked questions about understanding trading signals

    Are trading signals suitable for complete beginners in Australia?

    Signals can be a useful learning tool for beginners, but they are not a substitute for foundational knowledge. Without understanding the logic behind a signal, a beginner cannot distinguish a temporary drawdown from a broken system — and that distinction determines whether you hold or exit at the worst possible moment.

    How many trades should a signal provider have before I consider following them?

    As a personal heuristic, minding does not seriously evaluate any provider with fewer than 100 completed live trades. Below that number, the track record does not have enough data to distinguish skill from luck. This is the author’s working rule, not a statistical standard.

    What is the difference between a trading signal and copy trading?

    A trading signal is an alert you act on manually. Copy trading automatically replicates another trader’s positions in your account. Both carry the same underlying risks — the key difference is that copy trading removes the execution step, which also removes the opportunity to apply your own judgement about whether conditions are appropriate for your account size and risk tolerance.

    Do Australian regulations affect how signal providers operate?

    Yes. ASIC regulates financial services in Australia, and providers offering signal services that constitute financial advice must hold an Australian Financial Services Licence. Traders should verify whether a signal provider is ASIC-licensed or operating under an exemption before subscribing. Unlicensed providers offering what amounts to personal financial advice are operating outside the law.

    How long should I demo trade a signal before going live?

    A minimum of 30 completed trades or four weeks of real-time testing, whichever comes first. The goal is not just to assess profitability — it is to understand the signal’s behaviour across different market conditions and to calibrate your own execution process before real capital is at stake.

    Want a second set of eyes on your signal evaluation process?

    Reach out directly — Crazii JTVertex works with Australian traders at every stage, from choosing the right tools to building a testing framework that fits your schedule and risk profile.

    Get in touch

    Note: This article contains general information only and does not constitute personal financial advice. Trading CFDs, margin FX, and related instruments involves significant risk of loss. ASIC’s Report 828 found that 68% of Australian retail CFD clients lost money in FY2023–24. You should consider your own financial circumstances, objectives, and risk tolerance, and read all relevant Product Disclosure Statements and Target Market Determinations before trading. If you are uncertain, seek advice from a licensed financial adviser.
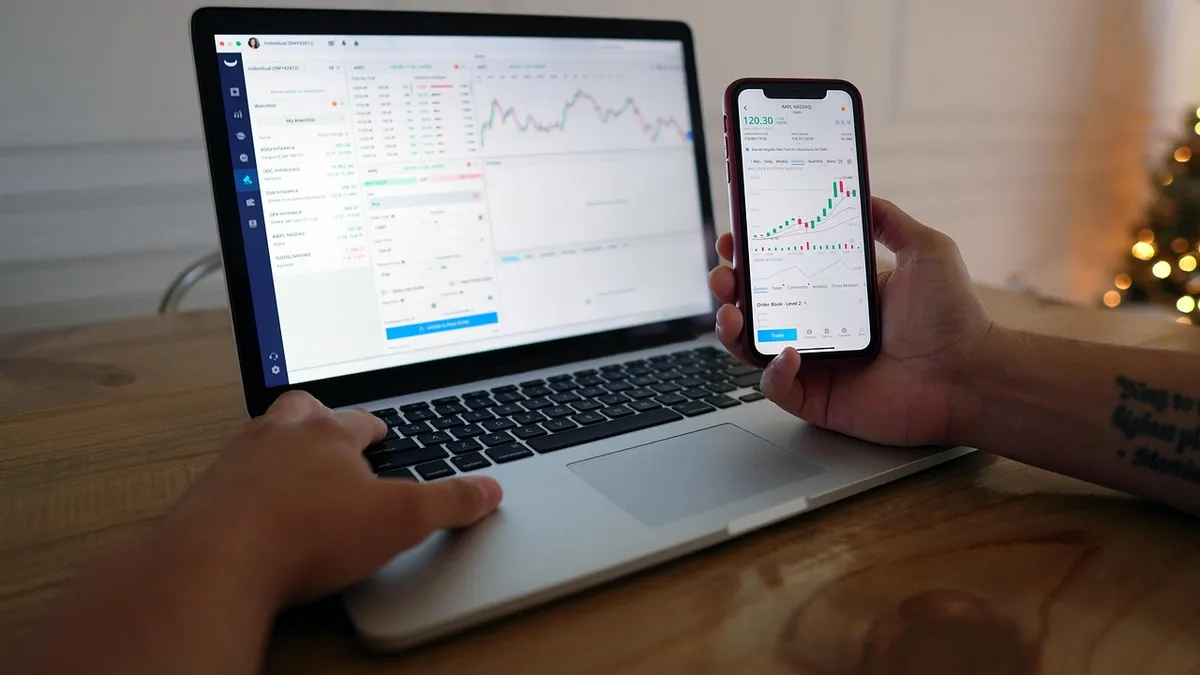
  • Can My Trading Signals Be Trusted or Are They Guesswork

    Can My Trading Signals Be Trusted or Are They Guesswork

    Can my trading signals be trusted, or am I essentially flipping a coin with extra steps? That question keeps more Australian traders awake than they’d care to admit — and the honest answer is: it depends entirely on what you’re measuring, and most traders are measuring the wrong things. At Crazii JTVertex, we’ve spent years sitting with this exact problem, and in this guide we’ll walk you through a clear, evidence-backed framework for telling the difference between a signal worth following and one that’ll quietly drain your account. By the end, you’ll know exactly which three numbers to check before trusting any signal provider — and you’ll never have to guess again.

    Note: This article is general information only and does not constitute personal financial advice. Trading CFDs and margin FX products carries significant risk of loss. Please consider your own financial circumstances and read all relevant disclosure documents before acting on any signal or trading tool.

    Not sure where to start with trading signals?

    Join the Crazii JTVertex community for real-time signal discussion, market breakdowns, and trader support — no fluff, no hype.

    Join the Group
    Table of contents

    Can trading signals actually be trusted — or is the whole thing guesswork?

    Can trading signals actually be trusted — or is the whole thing guesswork?
    💡

    Key points: Trading signals are not inherently guesswork, but they are probabilistic tools — not guarantees. A signal’s trustworthiness depends on the methodology behind it, the track record length, and whether the risk parameters are clearly disclosed. Without those three things, you’re flying blind.

    Here’s the situation most traders find themselves in. You’ve found a signal provider, the entry looked clean, you followed it — and then the market did exactly the opposite of what the signal said. Now you’re staring at a red position at 11 pm, wondering whether the whole concept is a scam. It’s not a scam. But it’s also not magic. Trading signals are, at their core, a structured opinion about what price is likely to do next, based on a defined set of rules. That opinion can come from a human analyst, an algorithm, or a combination of both. What separates a trustworthy signal from guesswork is not whether it wins every trade — nothing does — but whether the underlying logic is consistent, transparent, and has been tested across enough market conditions to have statistical meaning. The critical word there is “tested.” A signal provider who’s been running for three months in a trending bull market hasn’t proven anything. A provider with a verified three-year track record across trending, ranging, and volatile conditions is telling you something real. Minn, a 34-year-old electrician from Brisbane, started following signals about eight months before we first spoke. He’d chosen a provider based on a Telegram screenshot showing 14 consecutive winning trades. That’s not a track record. That’s a highlight reel. By the time he contacted Crazii JTVertex, he’d given back most of his starting capital because he had no framework for evaluating what he was following. The signal wasn’t the problem. The absence of a filter was.

    The evidence: According to ASIC’s Report 828 (published January 2026, covering FY2023–24), 68% of Australian retail CFD clients lost money — that’s 133,674 people with net losses exceeding $458 million in a single financial year. This isn’t because signals don’t work. It’s because most retail traders lack the evaluation framework to use any tool well.

    Expert tip: Crazii JTVertex looks at one specific thing first when reviewing a signal provider: the ratio of average winning trade to average losing trade, not the win rate. A provider with a 45% win rate but a 2.5:1 reward-to-risk ratio is mathematically profitable. A provider with an 80% win rate but a 0.4:1 ratio will eventually blow your account. Most traders get this backwards because wins feel better than maths.

    Signal Type Transparency Level Typical Track Record Trust Indicator
    Algorithm-based (verified) High — rules are fixed Backtested + live Strong if audited
    Human analyst Medium — depends on disclosure Often short Moderate
    Social media “calls” Low — no methodology Cherry-picked Weak
    Copy trading (MT5 verified) High — live stats visible Visible on platform Strong if 100+ trades
    So can trading signals be trusted? Yes — with a defined evaluation process. Without one, you’re not following signals. You’re following hope. Want to go deeper on the foundations before comparing specific tools? The guide on how to understand trading signals before risking real money covers the core concepts in detail.
    can my trading signals be trusted — signal evaluation framework by Crazii JTVertex
    Understanding what makes a trading signal trustworthy starts with the right evaluation criteria. · Photo: Pexels / Pixabay

    Want to see signals that show their working?

    Crazii JTVertex uses Crazii’s signal tools with full methodology transparency — built for Australian traders who want to understand what they’re following.

    See Crazii Signals

    What makes a trading signal reliable versus unreliable?

    What makes a trading signal reliable versus unreliable?
    💡

    Key points: A reliable trading signal has three non-negotiable qualities: a disclosed methodology, a statistically significant live track record (not backtested screenshots), and clearly stated risk parameters including stop-loss levels. Missing any one of these makes the signal unreliable by definition — regardless of how good the recent results look.

    What does reliability actually mean in trading? It doesn’t mean winning every trade. It means performing consistently with the stated methodology across varying market conditions. Think of it this way. A weather forecast isn’t reliable because it’s always right. It’s reliable because it’s right roughly as often as the model predicts, and you understand the confidence level before you pack an umbrella. Trading signals work the same way — you need to know the expected accuracy range before you size your position. The methodology question is where most retail traders stop looking too early. A signal that says “buy EUR/USD at 1.0850, stop at 1.0810, target 1.0920” is more trustworthy than one that just says “buy EUR/USD now.” The first version tells you the risk. It tells you the reward. It implies the provider has thought about what happens if they’re wrong. The second version tells you nothing except that someone has an opinion. Minn came back to this point when we spoke again three months later. He’d started filtering every signal he saw through one question: “Where’s the stop?” If a provider couldn’t or wouldn’t tell him, he moved on. That single filter alone changed his experience dramatically. Track record length matters enormously — and this is where the MetaTrader marketplace is genuinely useful. MetaQuotes reports that the MT5 Signals marketplace hosts over 3,200 free and commercial signal providers, each with live performance data visible before you subscribe. That’s roughly equivalent to having 3,200 candidates for a job, all with their résumés public. The problem is that most traders still choose based on the most recent month’s return rather than the full history. Minn’s rule of thumb, which is also mine: ignore any signal provider with fewer than 100 completed trades in their live history. That’s not a statistic — it’s a personal heuristic based on what I’ve seen. Under 100 trades, variance alone can make a mediocre strategy look brilliant.

    The evidence: ASIC Report 828 notes that 26,243 retail clients used copy trading in FY2023–24, with ASIC observing “a growing interest in copy trading.” The fact that copy trading — which is essentially following live signals automatically — is growing tells us traders want the concept to work. The question is whether they’re selecting providers with the right filters.

    Expert tip: Here’s something most signal review articles won’t tell you. A drawdown that recovers quickly is more revealing than a drawdown that never happened. When minn reviewed a provider who’d had a 22% drawdown in March 2024 and recovered it within six weeks, that told him more about the strategy’s resilience than three months of clean green trades. The absence of drawdown in a short track record usually means the track record is too short — not that the strategy is perfect.

    1

    Check the methodology first

    Before looking at any performance numbers, ask: does this provider explain what conditions trigger a signal? If the answer is “proprietary algorithm” with zero further detail, treat that as a yellow flag — not a red one, but worth more scrutiny.

    2

    Look at the full equity curve, not just the return figure

    A smooth upward equity curve with shallow drawdowns is more reliable than a jagged curve with a high headline return. Volatility in the equity curve means volatility in your account balance — which affects your ability to stay in the trade.

    3

    Verify the risk parameters on every signal

    Every entry signal should come with a stop-loss level. If it doesn’t, you have no way to define your risk before entering. That’s not a signal — that’s a suggestion.

    reliable trading signal characteristics — methodology and track record by Crazii JTVertex
    Reliable signals disclose methodology, show a full equity curve, and always include defined risk parameters. · Photo: TheInvestorPost / Pixabay

    Why do so many Australian traders lose money even with signals?

    Why do so many Australian traders lose money even with signals?
    💡

    Key points: Signals don’t cause losses — poor signal selection, over-leveraging, and ignoring fees do. ASIC data shows that 68% of Australian retail CFD clients lost money in FY2023–24, with fees alone flipping 5% of otherwise-profitable traders into a net loss. The signal is rarely the weakest link.

    Here’s the uncomfortable truth that almost nobody in the signal industry wants to say out loud. Most traders who lose money while following signals aren’t losing because the signals were bad. They’re losing because of what they do around the signal — the position size, the leverage, the broker fees, and the emotional decision to exit early or hold too long. ASIC’s Report 828 puts a precise number on the fee problem: $73 million of the $458 million in net retail losses in FY2023–24 came from fees alone. To make that concrete — that’s roughly one dollar in every six lost by Australian retail traders going straight to fees, not market moves. And ASIC found that 5% of retail clients would have been profitable if not for fees. Those traders did everything right on the signal side and still lost because of the cost structure around their trades. Think about that for a moment. One in twenty Australian traders who would have made money last financial year ended up in the red because of fees. Not bad signals. Fees. The leverage problem compounds this. Among active traders — defined as those with 50 or more open positions per month — 19% of otherwise-profitable clients lost money after fees. More trading correlated with worse outcomes. That runs directly counter to the instinct most new traders have, which is that more signals mean more opportunities mean more profit. Minn fell into exactly this pattern. In his first four months, he was following multiple signal providers simultaneously, taking four to six trades per day. His win rate was reasonable. His account was shrinking. When we looked at his trade history together, the fees on his high-frequency trades were quietly consuming the margin between his winners and his losers. The signal wasn’t broken. The approach around the signal was.

    The evidence: ASIC Report 828 (January 2026) found that 74% of new retail clients acquired via paid online advertising lost money in FY2023–24 — worse than the 68% sector average. Clients drawn in by flashy ad campaigns fared measurably worse. This suggests that the marketing environment around signals matters as much as the signals themselves.

    Expert tip: Crazii JTVertex has a specific rule about fees that isn’t written in any textbook. Before following a signal on any instrument, calculate the spread cost as a percentage of the signal’s stated stop-loss distance. If the spread is more than 15% of your stop distance, the signal needs to be significantly more accurate to remain profitable after costs. Most traders never run this calculation. It takes about 90 seconds and it’s changed how minn evaluates every signal he considers.

    For a broader look at how market structure affects signal quality — because a signal that works in a trending market can destroy an account in a ranging one — the article on what is market structure in trading and why traders ignore it is worth reading alongside this one.
    why Australian traders lose money with trading signals — fees and leverage by Crazii JTVertex
    Fees and over-leveraging are the two silent killers that undermine even well-chosen trading signals. · Photo: TheInvestorPost / Pixabay

    Want a signal tool built around Australian trading conditions?

    The best trading signals and tools for Australian traders in 2026 guide covers everything Crazii JTVertex recommends — including how to pair signals with the right cost structure.

    Read the Pillar Guide

    What are the most common mistakes traders make when following signals?

    What are the most common mistakes traders make when following signals?
    💡

    Key points: The three most damaging mistakes when following trading signals are: choosing providers based on short-term win streaks rather than verified track records, ignoring the stated stop-loss and risking more than planned, and following too many signal sources simultaneously — which creates conflicting positions and multiplies fee exposure.

    Mistake 1
    Choosing signals based on recent wins instead of verified history

    A 10-trade winning streak in a strong trending market tells you almost nothing about whether a signal provider will perform in a choppy or reversing market. The human brain is wired to see patterns in small samples — that’s why a screenshot of 14 green trades feels convincing. It isn’t. Require a minimum of 100 live trades before trusting any provider with real capital. That’s a personal heuristic from Crazii JTVertex, not a regulatory standard — but it’s one that’s saved more than a few accounts.

    Mistake 2
    Moving the stop-loss after entering the trade

    This is the single most common way a good signal turns into a large loss. The signal says stop at 1.0810. Price drops to 1.0815, touches your stop, and you move it to 1.0780 because “it’ll come back.” Sometimes it does. More often, you’ve just turned a defined, manageable loss into an account-damaging one. The stop-loss in a signal is part of the signal’s logic — removing it means you’re no longer following the signal, you’re improvising around it.

    Mistake 3
    Following multiple conflicting signal sources at the same time

    Minn was subscribed to three signal providers simultaneously at his worst point. Two said buy GBP/USD. One said sell it. He took all three positions. The fees on three trades where one immediately offset the others meant he was paying to go nowhere. Pick one signal source per instrument, per timeframe. Diversification in signal sources is not the same as diversification in trading — it’s often the opposite.

    The evidence: ASIC Report 828 highlights that 85% of retail clients lost money trading options CFDs in FY2023–24 — significantly higher than the 68% loss rate for standard CFDs. This “double-leveraged” product category sees worse outcomes, suggesting that complexity and leverage amplify signal-following errors rather than correcting them.

    Expert tip: The mistake Crazii JTVertex made early on — and this is the honest version — was treating a signal’s entry price as a hard trigger rather than a zone. If a signal says “buy at 1.0850” and price is currently at 1.0862, most beginners either skip the trade or enter at market anyway. The right approach depends on the signal’s stated methodology: if the signal is based on a support level, a 12-pip deviation might still be valid. If it’s based on a precise breakout level, those 12 pips might invalidate the whole setup. Knowing which is which requires understanding the methodology — which is why that’s always the first filter.

    For traders who want to go further into the technical layer beneath signal generation, the piece on best trading signals AI tools that work while you sleep covers how algorithmic signal generation handles these entry-zone questions automatically.
    common mistakes following trading signals — stop-loss and signal selection by Crazii JTVertex
    Moving your stop-loss after entry is one of the most costly mistakes a signal follower can make. · Photo: TheInvestorPost / Pixabay

    How do you evaluate a signal provider before risking real money?

    How do you evaluate a signal provider before risking real money?
    💡

    Key points: Evaluating a signal provider before committing real capital requires checking five things: live track record length (100+ trades minimum), maximum drawdown relative to average monthly return, reward-to-risk ratio across all trades, fee transparency, and whether the provider discloses what market conditions the strategy is designed for.

    So you’ve found a signal provider that looks promising. What do you actually do before you put money behind it? Start with the live track record, not the marketing page. If the provider operates on MetaTrader, their signal statistics are publicly visible — you can see the full equity curve, the number of trades, the average holding time, and the maximum drawdown before you subscribe to anything. That’s the starting point. If you can’t find a live, audited track record, that’s your answer. The maximum drawdown number is the one most traders skip over. Here’s why it matters: if a provider’s maximum drawdown is 35% and their average monthly return is 4%, you need roughly nine months of good performance just to recover from one bad period. That’s a risk profile most retail traders can’t stomach in practice, even if they think they can in theory. The reward-to-risk ratio question is equally important. Look at the average winning trade versus the average losing trade across the full history. A signal provider whose average winner is 1.8 times their average loser is structurally sound even with a win rate below 50%. That’s basic expectancy mathematics — and it’s the filter that separates professional signal evaluation from amateur signal selection. Does Minn apply all of this now? Mostly. He told me recently that the evaluation process feels slower than just picking a provider and starting — but that he’s been in his current signal setup for four months without a single week where he felt out of control of his risk. That’s the actual goal.

    The evidence: The MetaTrader 5 Signals marketplace hosts over 3,200 free and commercial signal providers with publicly visible live statistics. That’s 3,200 providers you can evaluate before spending a dollar — yet most traders spend more time researching a restaurant than a signal provider they’re about to follow with real capital.

    Expert tip: Crazii JTVertex uses a paper-trading period of at least two weeks before following any new signal with live capital. Not to see if the signal wins — two weeks is too short for that. But to understand the signal’s rhythm: how often it fires, what time of day, how long positions typically stay open, and whether the style fits your schedule and temperament. A signal that takes trades at 3 am Sydney time is technically valid but practically useless if you can’t monitor it. Fit matters as much as performance.

    Evaluation Criterion Minimum Standard Why It Matters
    Live trade count 100+ completed trades Reduces variance in performance assessment
    Maximum drawdown Below 20% (personal heuristic) Indicates risk control discipline
    Reward-to-risk ratio Above 1.5:1 average Determines mathematical expectancy
    Methodology disclosure At minimum, market/timeframe stated Lets you know when conditions suit the strategy
    Fee structure Fully disclosed before subscription Fees can flip profitable traders into losses
    how to evaluate a trading signal provider — checklist for Australian traders by Crazii JTVertex
    A structured evaluation checklist protects Australian traders from costly signal provider mistakes. · Photo: TheInvestorPost / Pixabay

    Frequently asked questions about trading signal reliability

    Frequently asked questions about trading signal reliability

    Are free trading signals as reliable as paid ones?

    Not necessarily. Free signals on MetaTrader have the same public statistics as paid ones, so reliability depends on the track record and methodology, not the price. Some free providers outperform paid ones. The evaluation criteria are identical regardless of cost.

    How many trades should a signal provider have before I follow them with real money?

    This is a personal heuristic from Crazii JTVertex, not a regulatory standard: a minimum of 100 completed live trades. Below that, variance alone can make a poor strategy look excellent. The more trades in the live history, the more meaningful the statistics become.

    Can trading signals be trusted for CFD trading in Australia?

    Signals can be a useful input for CFD trading, but ASIC data shows 68% of Australian retail CFD clients lost money in FY2023–24. Signals don’t eliminate that risk — they’re one tool among several. Position sizing, fee awareness, and understanding market structure matter just as much.

    What is a realistic win rate for a trustworthy signal provider?

    Win rate alone is misleading. A 45% win rate with a 2.5:1 reward-to-risk ratio is more profitable than an 80% win rate with a 0.4:1 ratio. Focus on expectancy — the combination of win rate and reward-to-risk — rather than win rate in isolation.

    Should I follow multiple signal providers at the same time?

    Generally, no. Following multiple providers on the same instrument creates conflicting positions and multiplies fee exposure. If you use more than one provider, ensure they cover different instruments or timeframes with no overlap in active trades.

    Ready to talk through your signal setup?

    Reach out to Crazii JTVertex directly — whether you want a second opinion on a provider you’re considering or help building an evaluation framework that fits your trading style.

    Get in Touch
  • What Are Signals in Trading That Actually Move Markets

    What Are Signals in Trading That Actually Move Markets

    What are signals in trading — and why do most traders get them completely wrong? Trading signals are specific, data-driven triggers that tell you when to enter or exit a position, based on price action, technical indicators, or market conditions. At Crazii JTVertex, we have spent years watching Australian retail traders lose money not because markets are cruel, but because they misread — or blindly follow — signals without understanding what is actually driving them. This guide on what are signals in trading that actually move markets will walk you through the mechanics, the traps, and the honest picture the data paints. By the end, you will know exactly how to read a signal, when to trust it, and when to walk away.

    Important note: This article is general information only and does not constitute personal financial advice. Trading CFDs, forex, and other leveraged products carries significant risk of loss. Please consider your own financial circumstances and read all relevant Product Disclosure Statements before trading.

    Ready to see real trading signals in action?

    Crazii JTVertex curates tools and resources built specifically for Australian traders who want clarity before they commit capital.

    Explore Crazii JTVertex
    Table of contents

    What are signals in trading and how do they actually work?

    What are signals in trading and how do they actually work?
    💡

    Key points: A trading signal is a data-driven trigger — generated by technical indicators, price patterns, or market conditions — that suggests a specific entry or exit point. Signals do not guarantee profit; they shift probability. Understanding the mechanism behind a signal is what separates informed traders from gamblers.

    It is 7:43 in the morning. Marcus, a 34-year-old civil engineer from Brisbane, opens his phone before his first coffee. He sees a Telegram message from a signals group: “BUY EURUSD NOW. TP: 1.0950. SL: 1.0870.” He places the trade. By lunch, the market has moved against him by 60 pips. He closes at a loss and wonders what went wrong. The signal was not necessarily bad. Marcus just had no idea what it meant or why it was generated. So — what is a trading signal, really? At its core, a signal is a conditional statement: “If X condition exists in the market, then Y action is suggested.” The condition might be a moving average crossover, an RSI reading below 30 (indicating oversold territory), a breakout above a resistance level, or a combination of several factors firing at once. The action is almost always a direction (buy or sell), an entry price, a stop-loss level, and a take-profit target. The mechanism matters enormously. A signal generated purely from a 14-period RSI crossing below 30 on a 15-minute chart is a very different beast from a signal generated by an algorithm that cross-references daily trend direction, volume confirmation, and session timing. One is a single data point. The other is a confluence of evidence.

    The evidence: According to ASIC’s Report 828 (published January 2026, covering FY2023–24), 68% of retail CFD clients in Australia lost money — that is more than 133,674 individual traders recording net losses exceeding $458 million in a single financial year. To put that in plain terms: for every three traders following signals and strategies in the Australian market last year, roughly two of them finished the year with less money than they started with.

    That figure is not an argument against trading. It is an argument for understanding what you are doing before you do it. Signals work by codifying market behaviour into repeatable, observable patterns. A moving average crossover, for instance, captures the idea that when short-term momentum overtakes long-term trend direction, price often continues in that direction — at least briefly. The signal does not create the move. It identifies a condition that has historically preceded certain outcomes. Here is the part most beginners miss: signals are probabilistic, not deterministic. They tell you that under similar historical conditions, price moved a certain way more often than not. They say nothing about this specific instance.

    Expert tip: Crazii JTVertex has reviewed hundreds of signal providers over the years. One pattern that almost never gets discussed publicly: the best-performing signals in back-tests almost always degrade within 90 days of being shared publicly, because once enough traders act on the same signal simultaneously, the market absorbs and neutralises the edge. If a signal has been “working” for years in a public Telegram group with 40,000 members, ask yourself why it is still working.

    Signal Component What It Tells You What It Does Not Tell You
    Entry price Where to open the position Whether the move will sustain
    Stop-loss Maximum acceptable loss per trade Whether price will respect that level
    Take-profit Target exit if the trade works Whether price will reach that level
    Direction (buy/sell) Suggested market bias Macro or news context driving price
    Timeframe Relevant chart period Higher timeframe trend alignment
    Marcus’s mistake was not following a signal. His mistake was following a signal without knowing what generated it, what conditions it assumed, or what risk he was taking on. That distinction is everything. The next question worth asking is: which types of signals actually carry weight in the market?
    what are signals in trading explained with chart indicators Crazii JTVertex
    Trading signals translate market data into actionable entry and exit points — but the mechanism behind each signal determines its reliability. · Photo: TheInvestorPost / Pixabay

    What types of trading signals move markets the most?

    What types of trading signals move markets the most?
    💡

    Key points: Trading signals fall into three broad categories — technical, fundamental, and sentiment-based. Each category carries different lag times, reliability windows, and risk profiles. The signals that move markets most dramatically are usually fundamental or sentiment-driven, but technical signals are what most retail traders actually use day-to-day.

    Not all signals are created equal. And honestly, the ones retail traders obsess over are rarely the ones that create the biggest market moves. Technical signals are the most common. They are generated by mathematical calculations applied to price and volume data. Moving average crossovers, RSI readings, MACD divergence, Bollinger Band squeezes — these are the bread-and-butter tools of retail technical analysis. They are lagging by nature, meaning they confirm what has already begun to happen rather than predicting what will happen next. Fundamental signals are different. An interest rate decision from the Reserve Bank of Australia, an employment report, or a shift in commodity export data — these create immediate, often violent price moves. They are not “signals” in the traditional charting sense, but they are the most powerful triggers in the market. Retail traders frequently ignore them, then wonder why their technical setup failed during a news event.

    The evidence: The MetaTrader platform alone hosts over 3,200 free and commercial signal providers through its built-in marketplace, according to MetaQuotes (MQL5, accessed June 2026). That is 3,200 different approaches to the same market — which tells you something important: there is no single “correct” signal. There are only signals that suit specific market conditions, timeframes, and risk tolerances.

    Sentiment signals are the third category and arguably the most underappreciated. These include positioning data, options market skew, and retail vs institutional flow imbalances. When retail sentiment becomes overwhelmingly one-directional — say, 85% of retail traders are long on a particular currency pair — contrarian signals from institutional players often follow. The crowd is frequently wrong at extremes. What does this mean practically? It means a buy signal on a 1-hour RSI chart carries very different weight depending on whether the daily trend is aligned, whether a major economic event is approaching, and whether retail positioning is already crowded in that direction.

    Expert tip: We learned this the hard way during a period of heavy AUD/USD trading. A textbook RSI oversold signal fired on the 4-hour chart — clean setup, confirmed by a support level. Entered the trade. Within 20 minutes, the RBA released commentary that shifted the market 80 pips in the opposite direction. The technical signal was “correct” in isolation. The macro context made it irrelevant. Now, we never enters a position within two hours of a scheduled economic release, regardless of how clean the technical setup looks.

    The distinction between signal types is not academic. It is the difference between a trade with genuine confluence behind it and a trade that looks good on a chart but has no real market driver supporting it. For a deeper look at how these signal types compare in practice, the guide on best trading signals and tools for Australian traders in 2026 breaks down specific tools and their track records in the current market environment.
    1

    Identify the signal category first

    Before acting on any signal, determine whether it is technical, fundamental, or sentiment-based. Each requires a different response framework and has different reliability windows.

    2

    Check timeframe alignment

    A buy signal on a 15-minute chart that contradicts a strong downtrend on the daily chart is low-probability. Always check the higher timeframe before acting on a lower timeframe signal.

    3

    Note upcoming economic events

    Check an economic calendar before entering any signal-based trade. Fundamental events can override even the most technically sound setups within minutes.

    types of trading signals technical fundamental sentiment Crazii JTVertex
    Technical, fundamental, and sentiment signals each carry different market weight — knowing which type you are following changes how you manage the trade. · Photo: TheInvestorPost / Pixabay

    Want to see which signal tools Crazii JTVertex actually uses?

    The Crazii community on Telegram shares real-time signal analysis and context — not just entry points, but the reasoning behind them.

    Join the Crazii Community

    Why do so many traders misread signals and lose money?

    Why do so many traders misread signals and lose money?
    💡

    Key points: Most retail traders lose money on signals not because signals are inherently unreliable, but because they follow them without understanding the underlying logic, ignore risk management, or overtrade. ASIC data shows that trading frequency itself is a significant predictor of loss after fees.

    Here is a question worth sitting with: if trading signals are so widely available, why do most retail traders still lose money? The honest answer is uncomfortable. The problem is rarely the signal itself. It is what happens before and after the signal fires. Marcus — remember him from Brisbane — eventually joined three different signals groups. He was placing 12 to 15 trades a week. His screen glowed at 11 pm as he watched positions move. He felt productive. He felt like he was doing the work. He was actually accelerating his losses. ASIC’s Report 828 (January 2026) contains a finding that does not get nearly enough attention: among active traders who opened 50 or more positions per month, 19% of those who would otherwise have been profitable ended up losing money after fees. Think about what that means. These were traders who had a working edge — but they traded so frequently that fees consumed their profits and then some. More activity did not mean more profit. It meant more cost.

    The evidence: ASIC’s FY2023–24 data also shows that 5% of all retail CFD clients would have made a net profit based on their trading outcomes alone, but ended up in a loss position solely because of fees. That is one in twenty traders who had the right instincts, executed reasonably well, and still lost money — because fees are a structural headwind that compounds with every trade you place.

    The second major misreading error is context collapse. A signal generated in a ranging market does not behave the same way in a trending market. A momentum signal that works brilliantly during a London session may produce the opposite result during a low-volume Asian session when spreads widen and price movement is choppy. Most retail traders apply signals uniformly, regardless of market context. That is like using the same recipe regardless of whether you have a gas stove or a campfire. The third error is the most psychologically interesting. When traders follow a signal and lose, they blame the signal. When they follow a signal and win, they credit their own judgement. This asymmetry means they never accurately evaluate the signal’s actual performance — they just cycle through providers, always one step behind the market.

    Expert tip: Crazii JTVertex tracks every signal followed over a minimum of 100 trades before drawing any conclusions about its validity. This is a personal heuristic, not a statistical standard — but it exists because anything under 100 trades is too small a sample to distinguish skill from luck. If a signals provider cannot show you at least 100 verified historical trades, treat their track record as unproven.

    You might be thinking right now: “This sounds like I should just avoid signals altogether.” That is not the conclusion. The conclusion is that signals are tools, and tools require skill to use. A hammer does not build a house on its own. The path forward is not fewer signals. It is better signal literacy — knowing what each signal measures, what conditions it was designed for, and what it cannot tell you.
    why traders misread trading signals and lose money Crazii JTVertex
    Overtrading and fee drag are two of the most documented causes of retail trading losses in Australia — ASIC Report 828 confirms the pattern. · Photo: sergeitokmakov / Pixabay

    Learn to read signals before risking real capital

    Crazii JTVertex points Australian traders toward tools and platforms that build genuine signal literacy — starting with the right foundations.

    See the 2026 Signal Tools Guide

    How do you evaluate whether a trading signal source can be trusted?

    How do you evaluate whether a trading signal source can be trusted?
    💡

    Key points: A trustworthy signal source shows verified trade history across at least 100 trades, discloses drawdown clearly, does not promise guaranteed returns, and explains the logic behind each signal. Opacity is a red flag. Any provider who cannot or will not show you their historical performance in detail is not worth your capital.

    So you have found a signals provider. They have a slick website, a Telegram group with thousands of members, and screenshots of winning trades. How do you know if they are worth following? Start with what they show you — and more importantly, what they do not show you. Winning trade screenshots are meaningless in isolation. Every provider has winning trades. The question is the ratio, the drawdown between wins, and the risk-to-reward on each trade. A provider who shows you ten wins in a row but never shows you a losing month is not transparent — they are curating. Look for verified performance data. On the MetaTrader platform, the built-in Signals marketplace (which hosts over 3,200 providers, per MetaQuotes) shows historical equity curves, maximum drawdown, and trade-by-trade records that cannot be edited after the fact. That is the kind of transparency that matters. A drawdown of 20% or more is, in Crazii JTVertex’s view, a meaningful red flag that warrants serious scrutiny — though what constitutes acceptable drawdown depends on your own risk tolerance and trading goals.

    The evidence: ASIC Report 828 (January 2026) noted that 26,243 retail clients in Australia used copy trading services in FY2023–24 — a figure ASIC described as reflecting “a growing interest in copy trading.” But that same report documented that 68% of all retail CFD clients lost money overall. Copy trading and signal-following are not inherently safer than independent trading; they carry the same structural risks.

    Second, pay attention to how a provider talks about risk. Any signals provider who uses language like “guaranteed profit,” “risk-free returns,” or “never lose” is not just misleading — they are describing something that does not exist in financial markets. Full stop. The moment you see that language, walk away. Third, consider the business model. Is the provider making money from your subscription fee, or from your trading outcomes? A provider who earns a referral commission every time you place a trade has an incentive to generate more signals, not better ones. That is a structural conflict of interest worth understanding before you hand over your trust.

    Expert tip: We once spent three months following a provider with an impressive-looking equity curve. The curve showed steady growth with minimal drawdown. What it did not show — and what we only discovered by reading the fine print — was that the provider used extremely wide stop-losses that were rarely hit, making the drawdown look small while the actual risk per trade was enormous. The equity curve looked smooth because losses were being deferred, not avoided. Always ask: what is the maximum stop-loss on each trade, not just the overall drawdown percentage.

    For a detailed breakdown of how to assess signal reliability before putting real money at stake, the article on whether your trading signals can be trusted or are just guesswork goes deeper into the verification process.
    What to Look For Green Flag Red Flag
    Trade history Verified 100+ trades, win/loss shown Screenshots only, no verified data
    Drawdown disclosure Maximum drawdown clearly stated Only winning periods highlighted
    Risk language Risk acknowledged on every signal “Guaranteed” or “risk-free” claims
    Business model Subscription fee, no trade incentive Commission per trade placed
    Signal logic Explains what generated the signal Just “buy” or “sell” with no context
    how to evaluate trading signal providers for Australian traders Crazii JTVertex
    Verified trade history and transparent drawdown data are the two non-negotiable standards when assessing any signal source. · Photo: geralt / Pixabay

    What are the most common mistakes traders make with signals?

    What are the most common mistakes traders make with signals?
    💡

    Key points: The three most damaging mistakes with trading signals are following signals without understanding the logic, ignoring fees as a structural cost, and overtrading in response to signal volume. Each of these mistakes compounds the others — and all three are documented in Australian retail trading data.

    Marcus eventually stopped trading for four months. Not because he gave up. Because he sat down one Sunday afternoon and actually counted what he had spent in fees over the previous six months. The number was not catastrophic. But it was enough to make him realise he had been treating fees as an afterthought when they were actually one of the biggest variables in his results. That is Mistake 1.
    Mistake 1
    Treating fees as a minor cost

    ASIC Report 828 (January 2026) found that $73 million of the $458 million in net retail losses in FY2023–24 came from fees alone. That is not a rounding error — it is a structural drag that compounds with every trade. Traders who follow high-frequency signal providers are particularly exposed, because more trades mean more fees, regardless of whether each individual trade is profitable.

    Mistake 2
    Following signals from paid advertising sources

    ASIC Report 828 specifically noted that 74% of retail clients acquired through paid online advertising lost money in FY2023–24 — worse than the already-high sector average of 68%. If you found your signals provider through a sponsored post, a YouTube ad, or a promoted Instagram account, the data suggests you are starting at a statistical disadvantage before you have even placed a trade.

    Mistake 3
    Applying signals without position sizing

    A signal tells you direction, entry, stop, and target. It does not tell you how much to risk. Traders who follow signals without a consistent position-sizing framework — risking 5% on one trade and 0.5% on the next based on gut feel — will have wildly inconsistent results even if the signals themselves are sound. Risk per trade should be determined before you look at the signal, not after.

    Who should probably not follow trading signals at all? If you are brand new to markets, have no understanding of leverage, and are looking for a shortcut to profit — signals will likely accelerate losses rather than prevent them. Signals are most useful when you already understand what they are measuring and can apply judgement about when conditions support or undermine the signal’s logic. The guide on how to understand trading signals before risking real money is the right starting point if you are at that earlier stage of the journey. And for those who want to see how specific signal tools compare in practice, the review at best trading signals for forex reviewed by active traders covers the current landscape with real performance data.
    common trading signal mistakes Australian retail traders Crazii JTVertex
    Fee drag, ad-sourced providers, and missing position sizing are three documented patterns behind retail trading losses in Australia. · Photo: TheInvestorPost / Pixabay

    Frequently asked questions about trading signals

    Frequently asked questions about trading signals
    💡

    Key points: These are the questions Australian traders ask most often about trading signals — answered directly, without the marketing language that surrounds most signal providers. No guaranteed outcomes, no hype. Just the honest mechanics.

    What are signals in trading and are they legal in Australia?

    Trading signals are data-driven triggers that suggest entry or exit points in a market. They are legal in Australia. However, providers who offer signals as part of a managed service or who give personalised financial advice may require an Australian Financial Services Licence (AFSL). Always check whether a provider is ASIC-regulated before subscribing.

    Can trading signals guarantee a profit?

    No. Trading signals are probabilistic tools, not guarantees. Any provider claiming guaranteed returns is making a statement that contradicts how financial markets work and is inconsistent with ASIC’s regulatory standards. Risk of loss is always present in leveraged trading products.

    How many trades should I evaluate before trusting a signal source?

    In Crazii JTVertex’s view — as a personal heuristic, not a statistical standard — fewer than 100 verified trades is too small a sample to draw reliable conclusions. A track record covering different market conditions (trending, ranging, high-volatility periods) is more meaningful than raw win rate alone.

    What is the difference between a trading signal and copy trading?

    A trading signal gives you information to act on yourself — you decide whether and how to trade. Copy trading automatically replicates another trader’s positions in your account. ASIC Report 828 noted 26,243 Australian retail clients used copy trading in FY2023–24, but copy trading carries the same loss risk as independent trading.

    Why do signals that work in back-tests often fail in live trading?

    Back-tests use historical data and cannot account for real-world factors: slippage, changing market conditions, the impact of many traders acting on the same signal simultaneously, and fees. A signal that appears profitable in back-testing may degrade quickly once deployed in live markets, particularly if it becomes widely known.

    Want to talk through your signal strategy with someone who has actually used these tools?

    Crazii JTVertex offers direct support for Australian traders building their first real framework — reach out through the contact page or join the community on Telegram.

    Get in Touch
  • Trading Signals Explained for Australian Beginners in 2026

    Trading Signals Explained for Australian Beginners in 2026

    Trading signals explained simply: they are alerts that tell you when to buy or sell a financial instrument, based on technical analysis, market data, or a provider’s strategy — so you are not staring at charts alone at midnight trying to guess what the market will do next. At Crazii JTVertex, we work directly with Australian traders who are taking their first serious steps into the market, and this guide on trading signals explained for Australian beginners in 2026 draws on real experience — not textbook theory. By the time you finish reading, you will know exactly what a trading signal is, how to read one, which mistakes to avoid, and how to decide whether signals are the right tool for where you are right now.

    Note: This article is general information only and does not constitute personal financial advice. Trading CFDs, forex, and other leveraged products carries significant risk of loss. Please consider your own financial circumstances and read all relevant Product Disclosure Statements before acting on any information here. If in doubt, speak with a licensed financial adviser.

    Not sure where to start with trading tools?

    Crazii JTVertex helps Australian beginners build a clear, structured path — starting with the right tools before choosing a platform.

    See how we can help
    Table of contents

    What are trading signals and how do they actually work?

    What are trading signals and how do they actually work?
    💡

    Key points: A trading signal is an alert — generated by a system, analyst, or algorithm — that suggests a specific trade action: buy, sell, or hold. It typically includes an entry price, a stop-loss level, and a take-profit target, giving you a structured decision rather than a gut feeling.

    Picture this. It is 7:14 on a Tuesday morning in Brisbane. Marcus, 34, a logistics coordinator who started trading six months ago, opens his phone and sees a notification from a signal provider: “EUR/USD — BUY at 1.0842, Stop-Loss 1.0810, Take-Profit 1.0890.” He has no idea whether to act on it or ignore it. He does not know if the number is good, bad, or already stale. So he closes the app and goes to work. Another opportunity — or another near-miss — passes him by. That moment of paralysis is exactly what trading signals are designed to prevent. A trading signal is a structured instruction built on a defined set of conditions. Those conditions might be technical — price crossing a moving average, RSI dropping below 30 (the standard oversold threshold defined by J. Welles Wilder), or a candlestick pattern forming at a key support level. They might be fundamental — a central bank rate decision or an employment data release. Or they might be a blend of both. The signal converts all of that analysis into a single, actionable output: what to trade, in which direction, at what price, and where to cut the loss if it goes wrong. The mechanism is straightforward. A signal provider — whether a human analyst, an automated algorithm, or a copy-trading platform — monitors markets continuously. When a predefined set of conditions aligns, the signal fires. It reaches you via a Telegram channel, an email, a push notification, or directly inside your trading platform. You then decide whether to act.

    The evidence: According to ASIC’s Report 828 (published January 2026, covering FY2023–24), 26,243 retail clients in Australia used copy-trading services — a format that automates signal execution entirely. That is a meaningful number, but it also means the vast majority of retail traders are still making execution decisions manually. Signals are the bridge between analysis and action, and most Australians are crossing that bridge on foot.

    Expert tip: Crazii JTVertex looks at one thing before trusting any signal source: the trade history log, not the win-rate headline. A provider claiming 80% accuracy with only 12 trades recorded is meaningless. We personally will not take a signal source seriously until it has at least 100 completed trades in its history — and even then, we checks whether those trades were taken during trending markets only, because signals that only fire in one market condition will leave you stranded the moment conditions shift.

    The critical thing to understand is that a signal is not a guarantee. It is a probability-weighted suggestion. The market does not care about the signal. What matters is how consistently the underlying logic behind that signal has performed across hundreds of trades, in different market conditions, with risk managed at every step.
    1

    Signal fires

    The provider’s system detects conditions that match its strategy rules and sends an alert to subscribers.

    2

    You receive the alert

    Via Telegram, email, app notification, or directly inside MetaTrader — depending on the provider’s delivery method.

    3

    You evaluate and decide

    You check the entry price is still valid (signals go stale fast), confirm your risk parameters, and choose to act or pass.

    4

    You manage the trade

    You set your stop-loss and take-profit as indicated, then monitor — not obsessively, but with a clear exit plan already in place.

    trading signals explained for Australian beginners Crazii JTVertex
    How a trading signal moves from analysis to alert to action — the core cycle every beginner needs to understand. · Photo: sergeitokmakov / Pixabay
    So before you read the next section, ask yourself: do you currently have a defined process for deciding when to enter a trade? If the honest answer is “not really,” signals might be the structure you have been missing.

    What types of trading signals do Australian beginners encounter?

    What types of trading signals do Australian beginners encounter?
    💡

    Key points: Trading signals fall into four main categories — manual (analyst-generated), automated (algorithm-driven), copy-trading (auto-executed), and social signals (community-sourced). Each carries a different risk profile, time demand, and learning curve. Knowing which type you are using changes how you should evaluate and act on it.

    Want to see which signal tools Australian traders are actually using?

    The best trading signals and tools for Australian traders in 2026 are covered in depth in our pillar guide — with real comparisons, not sponsored rankings.

    Read the full guide
    Not all signals are built the same, and treating them as interchangeable is one of the fastest ways to lose money. Manual signals come from a human analyst — someone who watches the charts, applies their strategy, and writes up a trade idea. These are often delivered via Telegram groups or newsletters. The quality depends entirely on the analyst’s skill and transparency. The upside is that a good analyst will explain the reasoning behind the signal, which means you are learning while you trade. The downside is that humans are inconsistent, and a busy week can mean delayed or missed signals. Automated signals are generated by algorithms — coded rules that fire when conditions are met, with no human emotion involved. They are faster and more consistent than manual signals, but they are only as good as the logic they were built on. An algorithm that was optimised on 2022 data might perform poorly in 2026 market conditions. Always ask: when was this system built, and what market environment was it tested in? Copy trading is a step beyond receiving a signal — it is having the signal executed automatically in your account when it fires in the provider’s account. MetaQuotes’ MQL5 platform lists over 3,200 free and commercial signal providers for MetaTrader alone, which sounds like abundance but is actually a filtering problem. More options means more noise to cut through. Social signals — trading ideas shared in communities, forums, or Discord servers — are the least structured and the most dangerous for beginners. Someone posting “going long on gold” with no stop-loss, no context, and no track record is not giving you a signal. They are giving you their opinion.

    The evidence: ASIC’s Report 828 notes that 74% of retail clients acquired via paid online advertising lost money in FY2023–24 — worse than the already-sobering sector average of 68%. That tells you something important: the flashiest, most-marketed signal services are not the safest ones to follow.

    Expert tip: We has seen traders subscribe to five different Telegram signal channels simultaneously, thinking more signals means more opportunities. What actually happens is signal conflict — one channel says buy EUR/USD, another says sell it, and the trader freezes or, worse, takes both trades and hedges themselves into a fee-heavy standstill. Pick one source. Understand it fully. Then decide whether it earns a place in your process.

    Signal Type Who generates it Execution Best suited for Key risk
    Manual (analyst) Human trader/analyst You act manually Learners who want context Inconsistency, delay
    Automated (algo) Algorithm/system You act manually or via EA Those who want speed and consistency Overfitting to past data
    Copy trading Lead trader Auto-executed in your account Those with limited time No learning, blind reliance
    Social signals Community members You act manually Experienced traders cross-checking ideas No accountability, no track record
    The type of signal you choose shapes your entire trading experience. If you are just starting out and want to understand what are signals in trading that actually move markets, the manual-with-explanation format is almost always the better starting point — even if it is slower.
    types of trading signals for beginners Australia Crazii JTVertex
    The four main signal types Australian beginners encounter — each with a different risk and learning profile. · Photo: TheInvestorPost / Pixabay
    Now that you know what kind of signal you might be dealing with, the next question is the one that actually matters in the moment: how do you read it without getting it wrong?

    How do you read a trading signal without getting it wrong?

    How do you read a trading signal without getting it wrong?
    💡

    Key points: Every valid trading signal contains four core components — the instrument, the direction, the entry price, the stop-loss, and the take-profit. Missing or ignoring any one of these turns a structured trade idea into a gamble. Reading a signal correctly means checking all five components before touching the execute button.

    Marcus — remember him from Brisbane — eventually did act on a signal. But he entered at the wrong price because he did not check whether the entry level was still valid. The market had moved 18 pips past the suggested entry by the time he placed the order. He was already behind before the trade started. That is the most common reading error. Signals go stale. Here is what every signal should contain, and what each part means for you: The instrument tells you what market you are trading — EUR/USD, gold (XAU/USD), the ASX 200, crude oil. This matters because different instruments have different volatility, spread costs, and trading hours. A signal for gold at 3 am Sydney time might be perfectly valid for a London-based trader and completely impractical for you. The direction is buy (long) or sell (short). Simple. But beginners sometimes confuse “sell” with selling something they own. In CFD and forex trading, you can sell short without holding the asset — you are speculating on the price falling. The entry price is where the signal provider expects you to open the trade. If the current market price has moved significantly past this level, the trade’s risk-to-reward ratio has already changed. We treats a signal as expired if the market has moved more than half the distance to the stop-loss past the entry point. The stop-loss is your safety net — the price level at which the trade closes automatically to limit your loss. Never remove it. Never widen it because the trade is going against you. The stop-loss is the signal provider’s acknowledgement that they could be wrong. The take-profit is the target — where the signal expects the trade to close in profit. This gives you the risk-to-reward ratio. If the entry is 1.0842, the stop is 1.0810 (32 pips of risk), and the take-profit is 1.0890 (48 pips of potential gain), the ratio is roughly 1.5:1. That means you need to win fewer than half your trades to break even over time — which is a reasonable foundation.

    The evidence: ASIC’s Report 828 found that among active retail traders — those with 50 or more open positions per month — 19% of those who would otherwise have been profitable ended up losing money after fees in FY2023–24. Think about what that means: more trades, more fees, worse outcomes. Reading a signal correctly includes deciding when not to trade it.

    Expert tip: Crazii JTVertex uses a simple filter before acting on any signal: if the current spread on the instrument is more than 20% of the signal’s stop-loss distance, we passes on the trade. For example, if the stop is 20 pips away and the spread is 5 pips, you are already 25% of the way to your stop before the trade even opens. Most beginners never calculate this. It is one of the quieter ways fees erode profitability — and it is exactly what ASIC’s data shows at scale.

    There is one more thing to check that almost nobody talks about: the time the signal was issued. A signal generated at 2:00 am AEST during thin Asian session liquidity may look very different when the London session opens at 5:00 pm AEST and volume floods back in. Context is not just about the numbers — it is about when those numbers were made.
    how to read a trading signal entry stop-loss take-profit Crazii JTVertex
    The five components of a valid trading signal — entry, direction, stop-loss, take-profit, and instrument — illustrated for beginners. · Photo: TheInvestorPost / Pixabay
    Reading signals correctly is a skill that compounds. Get it right consistently and you will start to see patterns in what works and what does not. But there is a faster way to learn — and that is by studying the mistakes first.

    Ready to see the best signal tools available to Australian traders?

    Crazii JTVertex has reviewed and ranked the top platforms — so you can compare before you commit to anything.

    See the top signal apps

    What are the biggest mistakes beginners make with trading signals?

    What are the biggest mistakes beginners make with trading signals?
    💡

    Key points: The three most damaging mistakes Australian beginners make with trading signals are: following signals without understanding the underlying logic, ignoring position sizing and treating every signal as an equal bet, and chasing win-rate without examining drawdown. All three are fixable — but only if you know they exist.

    Mistake 1
    Following signals blindly without understanding the logic behind them

    When you do not understand why a signal was generated, you cannot evaluate whether it is still valid by the time it reaches you. You also cannot learn from it. Blind following creates dependency — and dependency is the opposite of becoming a capable trader. Ask every provider: what is the underlying strategy? If they cannot or will not answer, that tells you everything.

    Mistake 2
    Treating every signal as an equal bet regardless of account size

    A signal that says “BUY gold” does not tell you how much to risk. That decision is yours. Beginners often risk the same dollar amount on every trade regardless of the stop-loss distance — which means a wide-stop signal carries far more risk than a tight-stop signal even though they feel identical. Position sizing is not optional. It is the difference between a losing streak and an account wipeout.

    Mistake 3
    Choosing a signal provider based on win-rate alone

    A provider with a 78% win-rate sounds impressive. But if their average loss is three times their average win, they are mathematically losing money over time — and so are you. Always ask for the average risk-to-reward ratio alongside the win-rate. A 50% win-rate with a 2:1 reward-to-risk ratio outperforms a 78% win-rate with a 1:3 ratio every single time.

    The evidence: ASIC’s Report 828 reports that 133,674 retail clients lost money in FY2023–24, with net losses exceeding $458 million — of which $73 million was fees alone. To put that in terms you can feel: $73 million in fees means the average losing client paid roughly $546 in fees on top of their trading losses. Fees are not a footnote. They are a structural drag that signals cannot overcome if your position sizing and provider selection are off.

    Expert tip: We once followed a signal provider for three weeks with a strong win-rate, then watched the account drawdown 22% in a single session when the provider held a losing trade through a major news event without a stop-loss. The lesson: always check whether the provider’s historical signals include stop-losses on every trade. If there are trades in their history with no defined exit, that is a red flag we will not ignore again. Personally, we treats any drawdown above 20% in a signal provider’s history as a disqualifying factor — not as a statistic, but as a personal heuristic based on that experience.

    Marcus eventually found a provider who explained every signal in plain language — the indicator that triggered it, the key level it was based on, and the market condition it was designed for. His results did not improve overnight. But his understanding did. And understanding is what compounds. If you are wondering whether trading is even the right move for you at this stage, the guide on should I do trading if I have never tried it before is an honest starting point worth reading before you go further.
    common trading signal mistakes Australian beginners Crazii JTVertex
    The three signal mistakes that cost Australian beginners the most — and how to avoid each one before they become expensive habits. · Photo: TheInvestorPost / Pixabay
    Avoiding mistakes is necessary. But it is not sufficient. The real question for 2026 is how signals fit into a broader strategy — and that is where the picture gets interesting.

    How do trading signals fit into an Australian beginner’s strategy in 2026?

    How do trading signals fit into an Australian beginner's strategy in 2026?
    💡

    Key points: Trading signals are a tool, not a strategy. For Australian beginners in 2026, the right sequence is: choose the right tools first, then select a trading platform, then integrate signals into a defined process. Signals work best as a learning accelerator and a decision-support layer — not as a replacement for your own understanding of the market.

    Here is the honest picture of the Australian retail trading landscape in 2026: according to ASIC’s Report 828, 68% of retail CFD clients lost money in FY2023–24. Only 32% made money, with net profits of $172 million after fees. And 5% of retail clients who would otherwise have been profitable were pushed into a loss purely by fees. That is not a reason to avoid trading. It is a reason to be structured about how you approach it. Signals fit into that structure as a first layer of decision support — not a crutch, and not a shortcut. The sequence that Crazii JTVertex recommends for Australian beginners is deliberate. Start with trading tools — signals, analysis platforms, risk calculators — before you choose a trading platform. This is because the tool you use shapes what you see, what you analyse, and what decisions feel natural. If you pick a platform first and then try to retrofit a signal service, you often end up with a disconnected workflow that adds friction rather than reducing it. Once you have a signal source you understand and a platform that supports it, the integration looks like this: you receive a signal, you check the market context (is the broader trend aligned with the signal direction?), you calculate your position size based on your account risk tolerance, you set the entry with the stop-loss and take-profit exactly as specified, and then you leave it alone. The discipline to leave it alone is harder than it sounds at 11 pm when the trade is moving against you.

    The evidence: The Australian CFD client base contracted significantly following ASIC’s product intervention measures — from approximately 515,000 active clients per quarter pre-intervention to around 119,300 active clients per quarter in FY2023–24. That 76% reduction reflects a more serious, more informed retail trading population. The casual, FOMO-driven trader has largely exited the market. The ones who remain are building real processes.

    Expert tip: Crazii JTVertex treats signals as a second opinion, not a first opinion. Before acting on any signal, we checks whether the trade makes sense on a higher timeframe chart. If a 15-minute signal says buy, but the daily chart shows a clear downtrend, we passes — regardless of how good the signal looks in isolation. This single filter has saved more losing trades than any other habit we has built. It takes 90 seconds. Most beginners never do it.

    The best signal apps Australian traders are using in 2026 are covered in detail in our guide on best trading signals apps Australian traders are using in 2026 — with real comparisons across delivery method, asset coverage, and track record transparency. The current you might be staring at charts with no clear process, second-guessing every entry, and feeling like everyone else has a system you do not. The version of you who uses signals correctly — with position sizing, provider vetting, and a higher-timeframe filter — does not make more trades. They make fewer, better ones. That is the shift signals are actually designed to create.
    trading signals strategy for Australian beginners 2026 Crazii JTVertex
    Where trading signals fit in an Australian beginner’s 2026 strategy — tools first, platform second, signals as structured decision support. · Photo: TheInvestorPost / Pixabay

    Frequently asked questions about trading signals for beginners

    Frequently asked questions about trading signals for beginners
    💡

    Key points: The questions below are the ones Australian beginners ask most often about trading signals — answered directly, without padding. If your question is not here, the contact page at Crazii JTVertex is the fastest way to get a real answer.

    Are trading signals legal in Australia?

    Yes, using trading signals is legal in Australia. However, providers who charge for signals and manage trades on your behalf may require an Australian Financial Services (AFS) licence. Always check whether a paid signal provider is ASIC-authorised before subscribing. Using signals to inform your own manual trading decisions does not require a licence on your part.

    Do trading signals work for complete beginners?

    They can — but only if you understand what the signal is telling you and why. Signals used without understanding create dependency, not skill. The most effective use of signals for beginners is as a learning tool: receive the signal, study the chart, understand the reasoning, then decide. Over time, you develop your own judgement alongside the signal’s guidance.

    How many trading signals should a beginner follow per day?

    Fewer than you think. ASIC’s data shows that more active traders — those with 50 or more positions per month — faced worse net outcomes after fees in FY2023–24. For beginners, one to three well-understood signals per day is a more sustainable starting point than chasing every alert. Quality of execution matters more than quantity of trades.

    What is the difference between a trading signal and copy trading?

    A trading signal is an alert you receive and act on manually. Copy trading automates that step — when the signal provider opens a trade, it opens automatically in your account at a proportional size. Copy trading removes the execution decision but also removes the learning. Signals keep you in the decision loop. For beginners who want to develop skills, manual signals are the better starting point.

    Can I trust free trading signals?

    Some free signals are genuinely useful — MetaTrader’s MQL5 marketplace lists over 3,200 signal providers, many with verifiable track records. Others are loss leaders designed to upsell you into paid services or affiliate products. The question is not whether a signal is free or paid — it is whether the provider shows a transparent, audited trade history with clearly defined stop-losses on every trade.

    Have a specific question about signals or getting started?

    Crazii JTVertex offers direct support for Australian traders — no automated responses, no sales scripts.

    Get in touch directly
  • Should I Do Trading If I Have Never Tried It Before

    Should I Do Trading If I Have Never Tried It Before

    Should you do trading if you have never tried it before? Honestly, yes — but only if you start with the right tools, not the right gut feeling. At Crazii JTVertex, we have watched hundreds of Australians step into the markets for the first time, and the ones who lasted were not the boldest or the richest. They were the ones who treated their first trade like a pilot treats a first solo flight: prepared, structured, and deeply aware of what could go wrong. In this guide, Crazii JTVertex will help you decide whether trading is right for you — and if it is, exactly how to take your first step without blowing your account before you even understand what happened. By the end, you will have a clear, honest answer and a concrete starting point built around your situation as a first-time trader in Australia.

    Not sure where to begin with trading tools?

    Crazii JTVertex has put together a resource specifically for Australian traders who are starting from zero — no jargon, no pressure.

    See the 2026 tools guide
    Table of contents

    Should I do trading if I have no experience — what the real numbers say

    Should I do trading if I have no experience — what the real numbers say
    💡

    Key points: According to ASIC’s Report 828 (January 2026), 68% of Australian retail CFD clients lost money in FY2023–24. That is not a reason to walk away — it is a reason to start differently. The 32% who made money did not get lucky. They started with structure.

    Meet James. Twenty-nine years old, works in logistics in Brisbane, scrolls through finance content at 11pm wondering whether he is missing something. He has never placed a trade. He has a bit of savings, a lot of curiosity, and one recurring thought: “Should I do trading, or is this just not for people like me?” That question is more important than any chart pattern James will ever learn. Here is the honest answer: trading is not for everyone, and it is not against anyone either. What it is — is a skill. Like driving. You would not sit behind the wheel of a car for the first time on a motorway at 110km/h. You would start in a car park. Trading is the same, except the car park is called a demo account, and the motorway is live CFD trading with leverage. The ASIC data is worth sitting with for a moment. In FY2023–24, 133,674 retail clients across Australia lost money trading CFDs. Net losses exceeded $458 million — including $73 million in fees alone. That is not a small number. To put it plainly: that is roughly the equivalent of every person in a mid-sized regional town losing money in a single year. But here is what that same ASIC Report 828 also tells us: 32% of retail clients made money, netting $172 million in profit after fees. They existed. They were not mythical. They were prepared.

    The evidence: ASIC Report 828 (published 20 January 2026) covers FY2023–24 Australian retail CFD data. Among clients acquired through paid online advertising, 74% lost money — worse than the sector average. This suggests that how you enter the market matters as much as when you enter it. Source: ASIC Report 828.

    So should you do trading if you have never tried it before? The question is not really “should I” — it is “how should I start.” The answer changes completely depending on that distinction.

    Expert tip: Crazii JTVertex has seen this pattern repeatedly: the traders who blow their first account are almost never the ones who were undercapitalised. They are the ones who skipped the tool layer entirely and went straight to placing live trades based on YouTube videos. Starting with a signal tool or a structured copy-trading setup is not a shortcut — it is actually the longer game, because it keeps you in the market long enough to learn.

    Trader typeOutcome (FY2023–24)Key factor
    All retail CFD clients68% lost moneyNo structured entry
    Clients via paid ads74% lost moneyHype-driven entry
    Profitable retail clients32% made $172M netPrepared, structured
    Active traders (50+ positions/month)19% of profitable ones lost after feesOvertrading eroded gains
    should I do trading as a beginner in Australia — Crazii JTVertex
    Understanding the real odds before you start trading in Australia — Crazii JTVertex · Photo: 3844328 / Pixabay

    Why do most beginners lose money trading, even when they try hard?

    Why do most beginners lose money trading, even when they try hard?
    💡

    Key points: Most first-time traders lose not because markets are random, but because they enter without a decision framework. Effort alone does not protect capital. Structure does. The mechanism behind most beginner losses is not bad luck — it is the absence of a repeatable process before the first trade is placed.

    James placed his first live trade three weeks after deciding to “give it a go.” He had watched a few videos, read a few Reddit threads, and felt confident. By Thursday of that same week, he had lost 40% of his starting balance. Sound familiar? It should, because it is the most common story in retail trading. The reason most beginners lose has nothing to do with intelligence or effort. It comes down to something simpler: they start with the wrong layer. Trading has two distinct layers — the tool layer and the platform layer. The tool layer is where you learn to read signals, understand market structure, and build a decision framework. The platform layer is where you execute live trades with real money. Most beginners skip the first layer entirely. They go straight to the platform, which is like trying to read a novel before you have learned the alphabet.

    The evidence: ASIC Report 828 found that among active retail traders placing 50 or more open positions per month, 19% of those who would otherwise have been profitable ended up losing after fees. More activity, without more structure, produces worse outcomes. The market does not reward effort — it rewards process.

    There is also the fee problem, and it is quietly devastating. ASIC’s data shows that 5% of retail clients would have made a net profit but ended up in a loss purely because of fees. That is one in twenty traders who did everything right on the trade side — and still lost money because they did not account for the cost of trading itself. Think about that: correct direction, wrong outcome. What does this mean for a first-timer? It means your first priority is not finding the right trade. It is building the right process. That process starts with understanding what a trading signal is, how to read it, and whether it is worth acting on — before you ever open a live position.

    Expert tip: We learned this the hard way. The first three months of trading, we was profitable on paper — tracking every signal, noting every entry and exit in a spreadsheet. Then we went live and immediately started deviating from the same signals because “it felt different with real money.” The tool layer is not just about information. It is about building the habit of trusting your framework when your hands are shaking.

    If you are asking whether you should start trading, the more useful question is: have you built a decision-making framework yet? If not, that is where to begin. Understanding what signals in trading actually move markets is the foundation that separates traders who last from traders who do not.
    why beginner traders lose money without a structured trading framework — Crazii JTVertex
    The gap between effort and structure — why most first-time traders in Australia struggle · Photo: sergeitokmakov / Pixabay

    Want a structured starting point instead of guesswork?

    The Crazii JTVertex community on Telegram is where Australian traders share real setups, real signals, and honest feedback — no hype.

    Join the group

    What trading tools should a first-timer in Australia actually start with?

    What trading tools should a first-timer in Australia actually start with?
    💡

    Key points: For Australian beginners, the tool layer comes before the platform layer. Start with a signal tool or structured trading resource that helps you build a decision framework. Only then should you open a live account. The sequence matters more than the speed.

    Here is where most “beginner trading guides” get it completely wrong. They jump straight to platform comparisons — which broker, which leverage, which account type. That is the second step. The first step is the tool layer. What does the tool layer look like in practice? It means having access to structured trading signals — clear, readable indicators that tell you when market conditions align with a specific setup. Not predictions. Not guarantees. Conditions. Think of it like a weather forecast. A signal does not tell you it will definitely rain. It tells you the pressure is dropping, humidity is rising, and cloud cover is building. You still decide whether to carry an umbrella. The signal just gives you better information than looking out the window and guessing. For Australian traders specifically, the tool layer matters because of how the local regulatory environment works. ASIC-regulated products — including CFDs and margin FX — are high-risk instruments. The best protection you have is not a stop-loss order (though that matters too). It is understanding why you are entering a trade before you enter it.

    The evidence: MetaQuotes reports that the MetaTrader platform hosts over 3,200 free and commercial signals in its built-in marketplace. That is not a small selection — that is an overwhelming one. For a beginner, more options is not better. One reliable, well-documented signal source with a track record of at least 100 trades is worth more than 50 untested ones.

    The best trading signals and tools for Australian traders in 2026 are not necessarily the most complex or the most expensive. They are the ones that give you a repeatable framework — the same logic applied consistently across different market conditions. James, from Brisbane, eventually found his footing not by finding a better broker, but by starting with a signal tool that forced him to answer three questions before every trade: what is the setup, what is the risk, and what is the exit. Simple. Boring. Effective.

    Expert tip: Crazii JTVertex recommends ignoring any signal provider with fewer than 100 documented trades in their history. This is a personal heuristic, not a statistic — but the reasoning is sound. Fewer than 100 trades is not a track record. It is a sample too small to tell you anything meaningful about consistency. A provider with 400 trades and a 55% win rate tells you far more than one with 20 trades and a 90% win rate.

    1

    Start with a demo account and one signal source

    Open a demo account on a regulated platform and follow a single, documented signal source for at least four weeks before placing any live trades. Track every signal — whether you act on it or not.

    2

    Build your decision checklist before going live

    Before your first live trade, write down the three conditions that must be present for you to enter. If all three are not there, you do not trade. This is your framework. It is not optional.

    3

    Move to a live account only after consistent demo results

    Consistent does not mean profitable every week. It means you are following your framework every time. Two to three months of disciplined demo trading is not wasted time — it is the foundation that keeps you in the game long-term.

    trading tools for first-time Australian traders starting with signals — Crazii JTVertex
    The tool layer first, then the platform — the right sequence for new traders in Australia · Photo: TheInvestorPost / Pixabay

    What are the biggest mistakes new traders make in their first three months?

    What are the biggest mistakes new traders make in their first three months?
    💡

    Key points: The three most damaging mistakes for new traders are not about picking the wrong stock or the wrong direction. They are structural: overtrading, ignoring fees, and abandoning a framework the moment it produces a losing trade. All three are avoidable with the right starting habits.

    At 2pm on a Tuesday, James is staring at a screen showing a position down 3%. His heart rate is up. His original plan said to hold until the end of the session. His gut is screaming to close now. He closes. The market reverses 20 minutes later and would have given him a profit. This is not a story about bad luck. It is a story about the most expensive mistake in trading: abandoning your framework under pressure.
    Mistake 1
    Overtrading to recover losses

    ASIC’s data shows that among active traders placing 50 or more positions per month, 19% of those who would otherwise have been profitable ended up losing after fees. More trades means more fees, more emotional decisions, and more deviation from the original framework. Trading less, with more conviction, almost always produces better outcomes for beginners.

    Mistake 2
    Ignoring the cost of trading itself

    ASIC Report 828 found that 5% of retail clients would have made a net profit but ended up losing purely because of fees — and that the sector’s total fee bill was $73 million in a single year. Fees are not a footnote. They are a material part of your outcome. Before you place a live trade, calculate exactly what each trade costs you in spread, commission, and overnight funding. If you cannot calculate it, you are not ready to place it.

    Mistake 3
    Choosing a platform before choosing a tool

    The platform is where you execute. The tool is where you decide. Most beginners spend hours comparing brokers and minutes thinking about their decision framework. This is backwards. A great broker with no framework produces losses. An average broker with a solid framework produces learning — and eventually, results.

    Expert tip: We once watched a trader with a genuinely good signal setup lose three months of gains in two weeks — not because the signals stopped working, but because he started “improving” them mid-drawdown. He added filters, changed timeframes, second-guessed every entry. The signals were fine. The behaviour was not. The hardest discipline in trading is not finding a good setup. It is leaving it alone long enough to let it work.

    Want to know whether the signals you are following are actually trustworthy? That is a separate question worth answering carefully — and whether your trading signals can be trusted or are just guesswork is exactly what the next layer of your education should cover.

    Ready to move from questions to a real trading setup?

    Crazii JTVertex uses AIMS as a structured starting point for Australian traders — a tool-first approach built around real signals, not hype.

    Get started with AIMS
    common mistakes first-time traders make in Australia — Crazii JTVertex
    The three structural mistakes that end most beginners’ trading journeys before they begin · Photo: TheInvestorPost / Pixabay

    Is copy trading or signal-following a smarter entry point for beginners who want to start trading?

    Is copy trading or signal-following a smarter entry point for beginners who want to start trading?
    💡

    Key points: Copy trading and signal-following are not the same thing, and for beginners, the distinction matters. Signal-following builds your own decision framework. Copy trading outsources it. Both have a place — but for long-term development, signal-following teaches you something copy trading never will: how to think like a trader.

    Here is the question we hear most from first-timers: “Can I just copy someone who already knows what they are doing?” Honest answer: yes, you can. And for some people, that is a perfectly reasonable starting point. But there is a cost that does not show up in the performance charts. Copy trading, as ASIC’s data shows, is growing in Australia — 26,243 retail clients used copy trading services in FY2023–24. That is a meaningful number. But copy trading also means you are completely dependent on another trader’s decisions. When their drawdown hits 30%, you feel it. When they change their strategy without warning, you are along for the ride. And when they eventually stop trading — because all signal providers eventually do — you are back to square one, with no framework of your own. Signal-following is different. A signal tells you: here is a setup, here is the reasoning, here is the risk level. You still decide whether to act. That decision-making muscle is what copy trading never exercises.

    The evidence: ASIC Report 828 notes that only 121 retail clients used managed-account services in FY2023–24 — described as “not widely used.” The contrast with the 26,243 copy traders is striking. Most beginners want some guidance, but not full delegation. Signal-following sits in that middle ground: informed guidance with personal accountability.

    For James in Brisbane, the turning point came when he stopped copying a trader and started following a structured signal feed instead. The difference was not the win rate — it was that he understood why each trade was being placed. That understanding meant he could hold a position through a 2% drawdown without panicking, because he knew the reasoning behind it. The best trading signals Telegram groups that deliver real results are not the ones with the loudest calls or the biggest claimed win rates. They are the ones that explain the reasoning behind each signal clearly enough that you could replicate the logic yourself. That is the difference between a crutch and a teacher.

    Expert tip: Crazii JTVertex’s personal rule for evaluating any signal provider: after following them for 30 days, can you explain their entry logic in two sentences without looking at their notes? If you cannot, you are copying, not learning. The goal is always to eventually not need the signal at all — because you have internalised the framework.

    Currently, you might be reading this and thinking: “This sounds good in theory, but I still do not know where to actually start.” That is fair. And it is exactly the right thing to be thinking at this point. The answer is not another article. It is a first step.
    copy trading versus signal following for beginner traders in Australia — Crazii JTVertex
    Copy trading versus signal-following — what each approach actually teaches a new trader · Photo: TheInvestorPost / Pixabay

    Frequently asked questions about starting trading in Australia

    Frequently asked questions about starting trading in Australia
    💡

    Key points: These are the questions most first-time Australian traders ask before placing their first trade. Honest, direct answers — no fluff, no promises, no guaranteed outcomes.

    Should I do trading with a small amount of money first?

    Yes. Starting with a small live amount after a demo period is a sensible approach. The purpose is not to make money immediately — it is to experience the emotional difference between demo and live trading without risking capital you cannot afford to lose. Keep the amount small enough that a total loss would not affect your financial wellbeing.

    Is trading in Australia regulated, and does that protect me?

    CFD and margin FX trading in Australia is regulated by ASIC. Regulation means brokers must meet specific standards, but it does not protect you from losing money. ASIC’s own data shows 68% of retail CFD clients lost money in FY2023–24. Regulation protects the integrity of the market, not the outcome of your trades.

    How long does it take to become a consistently profitable trader?

    There is no universal timeline, and anyone who gives you a specific number is guessing. What the data does suggest is that traders who rush — placing high volumes of trades early — tend to fare worse than those who build slowly. Treat the first six to twelve months as education, not income generation.

    What is the difference between a trading signal and a trading tip?

    A trading tip says “buy this.” A trading signal says “here are the conditions present in the market right now, and here is the setup they create.” A signal gives you context and reasoning. A tip gives you an instruction with no framework. For a beginner, the reasoning matters more than the call itself.

    Can I trade CFDs in Australia without any prior experience?

    Legally, yes. Practically, it carries significant risk. ASIC data shows that 85% of retail clients lost money trading options CFDs in FY2023–24 — the highest loss rate of any product category. Standard CFDs are not far behind. Prior experience, or at minimum a structured demo period with a clear decision framework, is strongly advisable before going live.

    Have more questions about getting started?

    Reach out to Crazii JTVertex directly — no sales pitch, just a straight conversation about whether trading makes sense for your situation right now.

    Contact Crazii JTVertex

    Note: This article is general information only and does not constitute personal financial advice. Trading CFDs, margin FX, and related products involves significant risk of loss. Past performance is not indicative of future results. Please consider your own financial circumstances and read all relevant disclosure documents before trading. If you are unsure, seek advice from a licensed financial adviser.
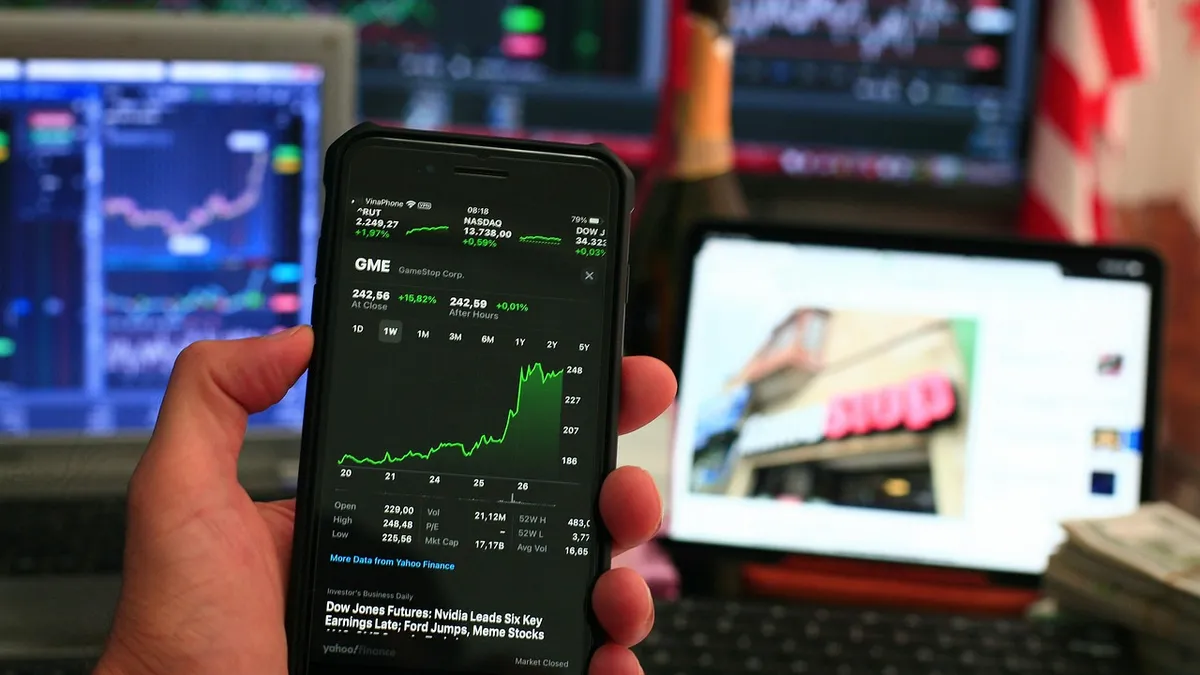
  • Best Trading Signals Book Every Serious Trader Should Own

    Best Trading Signals Book Every Serious Trader Should Own

    The best trading signals book you choose right now could be the single variable that separates a year of costly guesswork from a year of deliberate, structured progress. At Crazii JTVertex, we have spent years watching Australian traders burn through capital not because they lacked discipline, but because they built their signal-reading skills on shaky foundations — YouTube clips, forum tips, and half-finished courses. This guide, Best Trading Signals Book Every Serious Trader Should Own, cuts through that noise. By the end, you will know exactly which books are worth your time, which ones are overrated, and how to use what you read to make genuinely better trading decisions — starting this week.

    Note: The content on this page is general information only and does not constitute personal financial advice. Trading CFDs, forex, and other leveraged products carries significant risk. Please consider your own financial circumstances and read all relevant disclosure documents before trading. According to ASIC Report 828, 68% of retail CFD clients in Australia lost money in FY2023–24.

    🛠️ Ready to Put Your Reading Into Practice?

    Trading Signals Platform

    Access Real-Time Signals via Crazii

    Reading about signals is one thing. Applying them with a live platform is another. Most traders stall at the gap between theory and execution.
    Start With Crazii
    Community + Support

    Join the JTVertex Trader Group

    Books give you knowledge. Community gives you accountability. Both together is where the real progress happens.

    Join the Group

    Before You Read Another Page — Get the Right Foundation

    Crazii JTVertex has put together a practical starting point for Australian traders who want signals that actually connect to real market conditions.

    See the 2026 Signals Guide
    Table of contents

    What Makes a Trading Signals Book Worth Reading in 2026?

    What Makes a Trading Signals Book Worth Reading in 2026?
    💡

    Key points: A genuinely valuable trading signals book teaches you the underlying mechanism behind each signal — not just what to do, but why price behaves that way. Books that skip the “why” leave you dependent on rules you cannot adapt when market conditions shift.

    Meet James. He is 34, works in logistics in Brisbane, trades on his lunch break and after the kids go to bed. He bought three trading books in his first year. Read all three. Took notes. And still blew through a chunk of his starting capital because nothing in those books told him what to do when the signal said one thing and the news said another. That is the gap most trading signal books never close. Here is what actually separates a book worth your shelf space from one that collects dust. First, it must explain the mechanism. Why does a moving average crossover matter? Because it reflects a statistical shift in the average price paid over two different time horizons — when the shorter period crosses above the longer, recent buyers are paying more than historical buyers, suggesting momentum is shifting. A book that just says “buy when the 50 crosses the 200” without that explanation is giving you a rule without a reason. Second, the book must be honest about failure rates. No signal works every time. The RSI (Relative Strength Index), for example, uses 30 as the standard oversold threshold and 70 as overbought — thresholds established by J. Welles Wilder. But in a strong trending market, price can stay above 70 for weeks. A good book tells you that. A bad book shows you cherry-picked charts. Third — and this is the one most traders ignore — the book should address the cost of being wrong. ASIC’s Report 828 found that 5% of retail clients who would have been profitable ended up in a net loss purely because of fees. That means signal quality alone is not enough. A book that ignores trading costs is teaching you to win battles while losing the war.
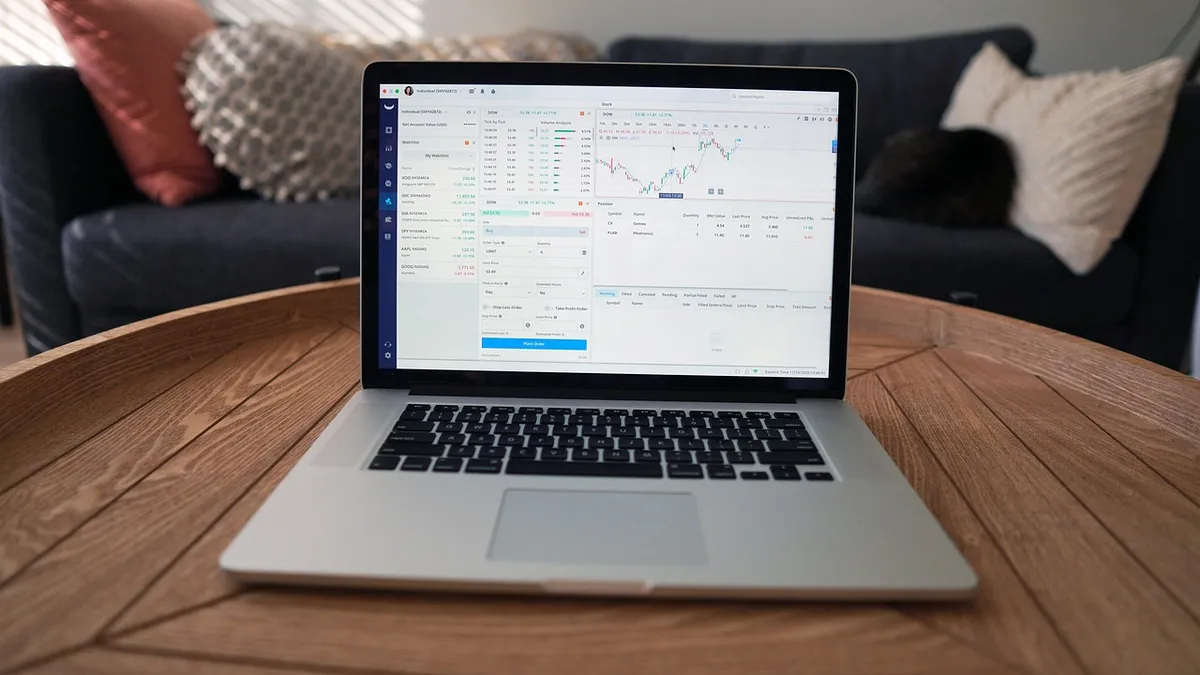
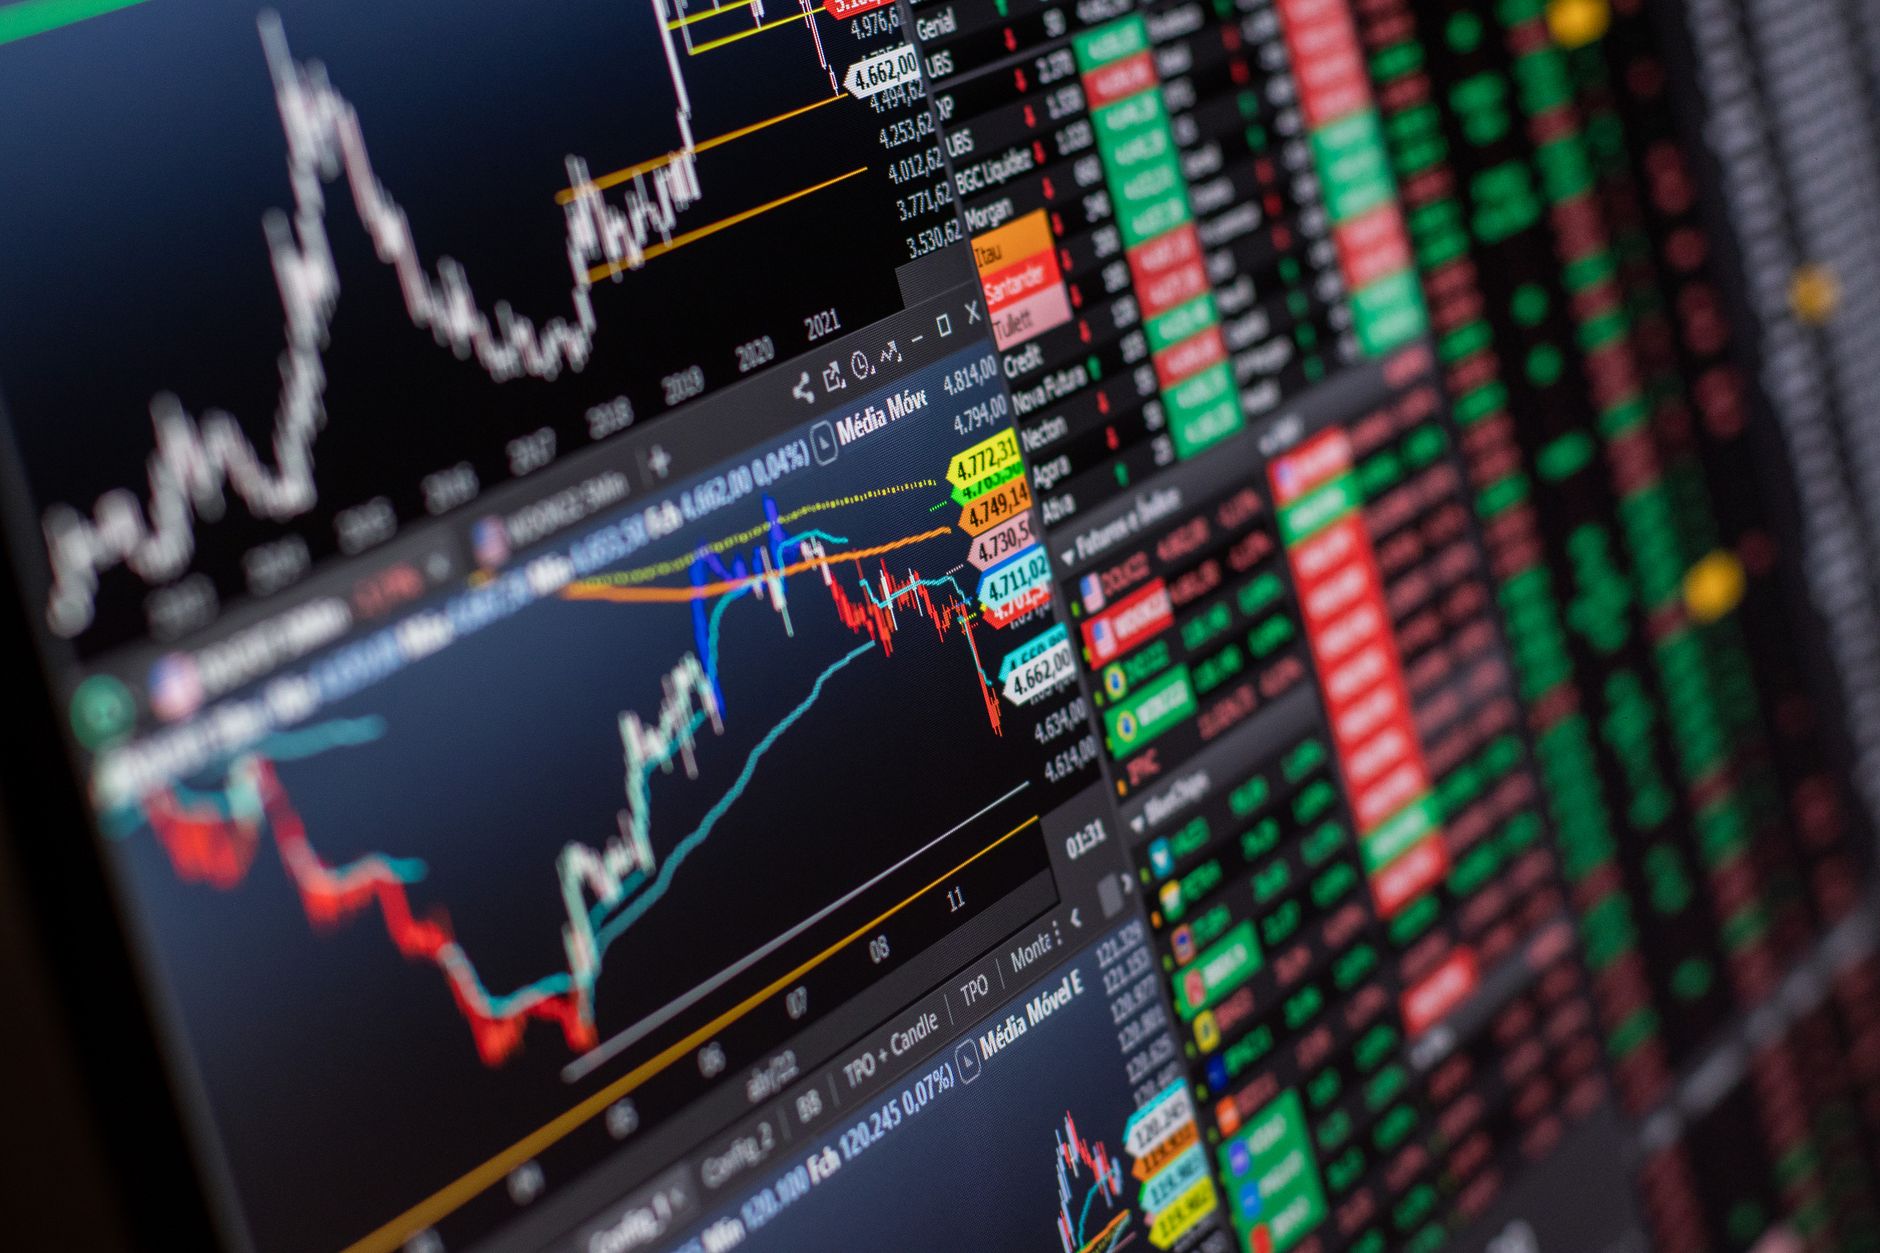
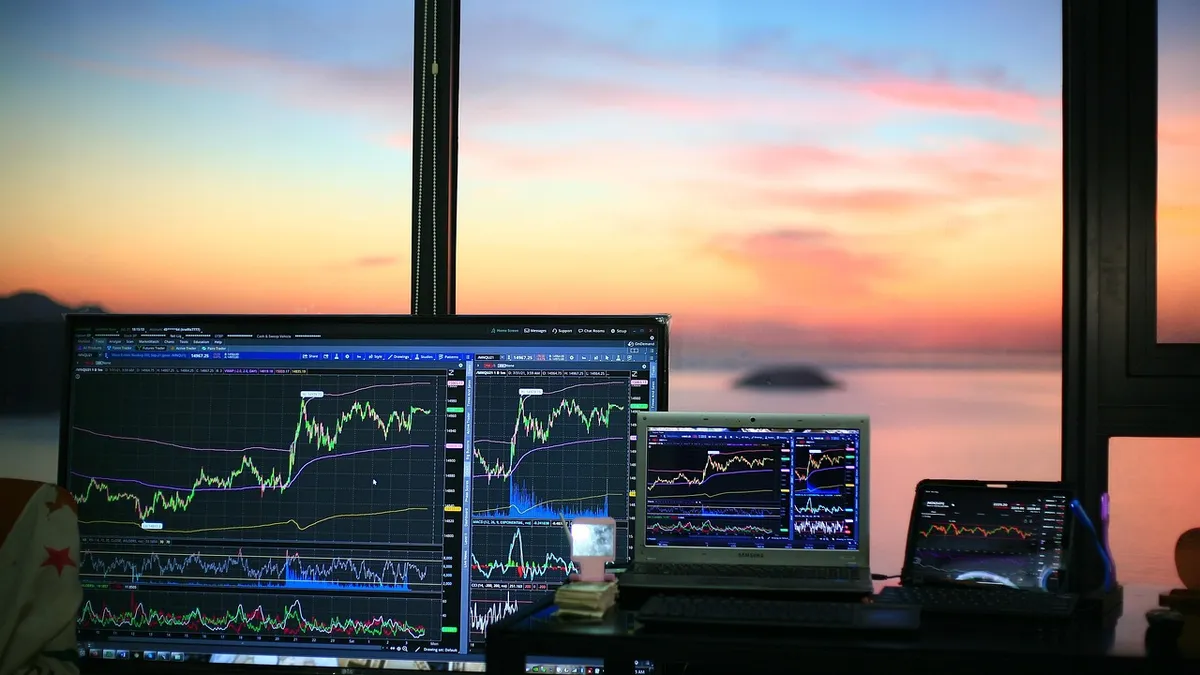
    The evidence: According to ASIC Report 828 (published January 2026, covering FY2023–24), 68% of Australian retail CFD clients lost money — a figure that includes 133,674 individual traders with net losses exceeding $458 million. Of that, $73 million was attributable to fees alone. A book that does not address cost management is incomplete for the Australian market.

    Expert tip: Crazii JTVertex’s personal filter for any trading book: flip to a random chapter and look for the phrase “this signal fails when…” If the author does not address failure conditions, put the book down. Every signal has a market environment where it breaks. The best books map those environments explicitly — not in a footnote, but as a core teaching point.

    CriteriaStrong BookWeak Book
    Explains signal mechanismYes — with market structure contextRules only, no “why”
    Addresses failure conditionsDedicated sections on when signals breakCherry-picked winning examples
    Covers trading costsIntegrates fees into strategy evaluationIgnores cost drag entirely
    Applicable to current marketsPrinciples-based, adaptableOverfitted to one era or one market
    James eventually found one book that changed his approach. Not because it gave him better signals — but because it made him understand why his previous signals had failed. That shift is what we are building toward here.
    best trading signals book criteria for Australian traders Crazii JTVertex
    Evaluating a trading signals book: what separates genuine education from noise. · Photo: 3844328 / Pixabay

    Which Trading Signals Books Are Actually Worth Owning?

    Which Trading Signals Books Are Actually Worth Owning?
    💡

    Key points: The most enduring trading signals books focus on reading price behaviour and indicator logic rather than promoting a single rigid system. For Australian retail traders, books that integrate risk management alongside signal identification are the most practically useful.

    Want Signals That Work Right Now — Not Just in a Book?

    Understanding signal theory is step one. Applying it on a live platform with real market data is step two. The AIMS platform gives you that bridge.

    Open an AIMS Account
    So which books actually deliver? Let me be direct about this. “Technical Analysis of the Financial Markets” by John J. Murphy is the closest thing to a compulsory text in this space. It covers every major signal category — trend indicators, momentum oscillators, volume signals, and chart patterns — with enough depth to build a genuine framework rather than a checklist. The RSI, MACD, Bollinger Bands, and moving average systems are all explained with their underlying logic intact. If you own one book on trading signals, this is it. The limitation: it was written with US equity markets as the primary reference. Australian traders need to adapt the context, particularly around session timing and liquidity. “Trading in the Zone” by Mark Douglas does something different. It does not teach you signal mechanics. It teaches you why you ignore the signals you already know. That might sound like psychology fluff, but here is the practical reality: James — our Brisbane trader — had the right signals on his screen. He second-guessed them because of two bad trades the week before. Douglas explains that mechanism with clinical precision. It is arguably the most important book for any trader who has read the theory and still cannot execute consistently. “The New Trading for a Living” by Alexander Elder is worth owning because Elder is one of the few authors who explicitly builds position sizing and stop-loss discipline into the signal framework. His “Triple Screen” system — using three different timeframes to confirm a signal before entering — is a practical, testable approach that works across forex, commodities, and indices. For traders specifically interested in the MetaTrader ecosystem — which hosts over 3,200 free and commercial signals across MT4 and MT5 according to MetaQuotes — the platform’s own documentation and MQL5 community resources function as a living textbook. That is not a book in the traditional sense, but it is more current than anything printed.

    The evidence: MetaQuotes reports that the MetaTrader platform hosts 3,200+ signals in its built-in marketplace (MQL5, accessed June 2026). Understanding how to evaluate those signals — their drawdown history, trade count, and risk profile — requires the same analytical framework the best books teach.

    Expert tip: Crazii JTVertex’s honest admission: we spent the first year reading books in the wrong order. Started with advanced Elliott Wave theory before understanding basic trend structure. It is like learning to parallel park before you know how to steer. Start with Murphy. Then Elder. Then Douglas. In that order. The sequence matters more than the titles.

    One thing we will say plainly: no book published before 2020 adequately addresses algorithmic signal interference — the reality that high-frequency trading and algorithmic execution now distort many of the classic signal patterns at lower timeframes. That is a gap every modern trader needs to be aware of, regardless of what they read. If you are just beginning to understand how signals work in the Australian context, the Trading Signals Explained for Australian Beginners in 2026 guide is the right place to build that foundation before diving into any of these books.
    top trading signals books recommended for Australian retail traders Crazii JTVertex
    Recommended reading for traders building a signal-based framework in the Australian market. · Photo: Pexels / Pixabay

    How Do You Read a Trading Signals Book Without Wasting the Lessons?

    How Do You Read a Trading Signals Book Without Wasting the Lessons?
    💡

    Key points: Reading a trading signals book passively produces almost no lasting skill. The traders who extract real value treat each chapter as a test hypothesis — they read a concept, immediately apply it to a historical chart, and document what they observe before moving on.

    Here is an uncomfortable truth: most traders who buy the right book still do not improve. The book was not the problem. The reading method was. So how do you actually absorb this material?
    1

    Read One Signal Concept at a Time — Then Stop

    Do not read a chapter straight through. Read until you hit a new signal or indicator. Close the book. Open a charting platform. Find five historical examples of that signal on an instrument you actually trade. Write down what happened after each one — not what “should” have happened according to the book, but what actually happened on the chart in front of you. This single habit is worth more than reading ten books cover to cover.

    2

    Build a Personal Signal Log Before You Trade Live

    Create a simple spreadsheet: signal name, timeframe, instrument, entry condition, expected outcome, actual outcome. After 50 documented observations, you will have your own data set — not the author’s data from a different decade and a different market. This is the step that transforms reading into skill. We personally ran this process for three months on AUD/USD before placing a live trade using a new signal framework.

    3

    Test Against the Failure Conditions the Author Describes

    Go looking for the times the signal broke. Deliberately find the chart examples where the RSI hit 30 and price kept falling. Where the MACD crossover triggered and immediately reversed. Understanding why a signal fails — and in which market conditions — is more valuable than memorising when it works. The failure map is your real edge.
    4

    Connect Every Signal to a Risk Parameter Before You Apply It Live

    Every signal you decide to use needs a corresponding stop-loss logic and a position size rule before it goes live. This is non-negotiable. Among active traders placing 50 or more open positions per month, ASIC found that 19% of otherwise-profitable clients ended up in a net loss after fees in FY2023–24. More activity without better risk management makes outcomes worse, not better. The book teaches the signal. You must supply the discipline.

    Expert tip: Crazii JTVertex’s actual practice when testing a new signal from a book: we never use a round number for the observation sample. The minimum is 47 historical examples — not 50. Why? Because 50 feels like a target to hit and you stop paying attention. 47 keeps you counting. It is a small psychological trick but it genuinely improves the quality of observation.
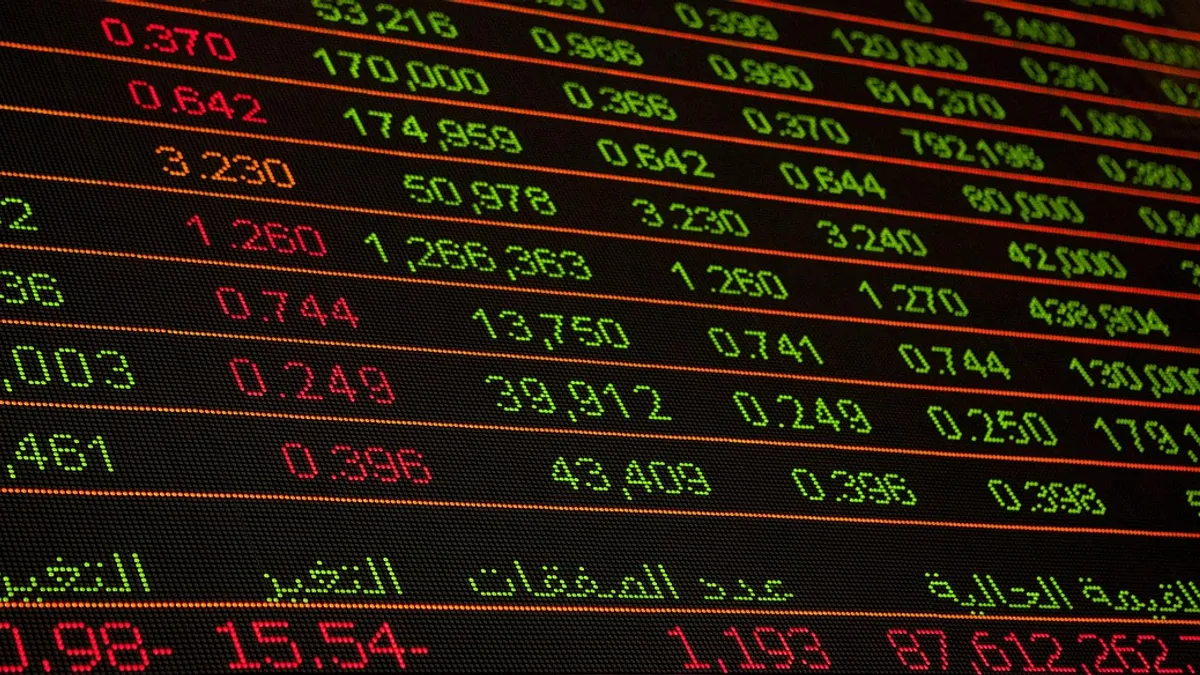
    James applied this method to Elder’s Triple Screen system. He spent six weeks documenting examples on the ASX 200 and AUD/USD before going live. His first three months using the system live were not spectacular — but he did not blow up. That is the real benchmark in the first year. If you are weighing whether trading is right for you before committing to this level of study, the piece on Should I Do Trading If I Have Never Tried It Before addresses that question honestly.
    how to apply trading signals book lessons to live chart analysis Crazii JTVertex
    Translating signal theory into a personal testing process — the step most traders skip. · Photo: TheInvestorPost / Pixabay

    What Are the Most Common Mistakes Traders Make After Reading Signal Books?

    What Are the Most Common Mistakes Traders Make After Reading Signal Books?
    💡

    Key points: The most damaging mistake after reading a trading signals book is treating the signals as rules rather than probabilities. Every signal is a statement of likelihood in a specific context — not a guarantee of outcome. Traders who forget this oversize their positions and underestimate the cost of being wrong.
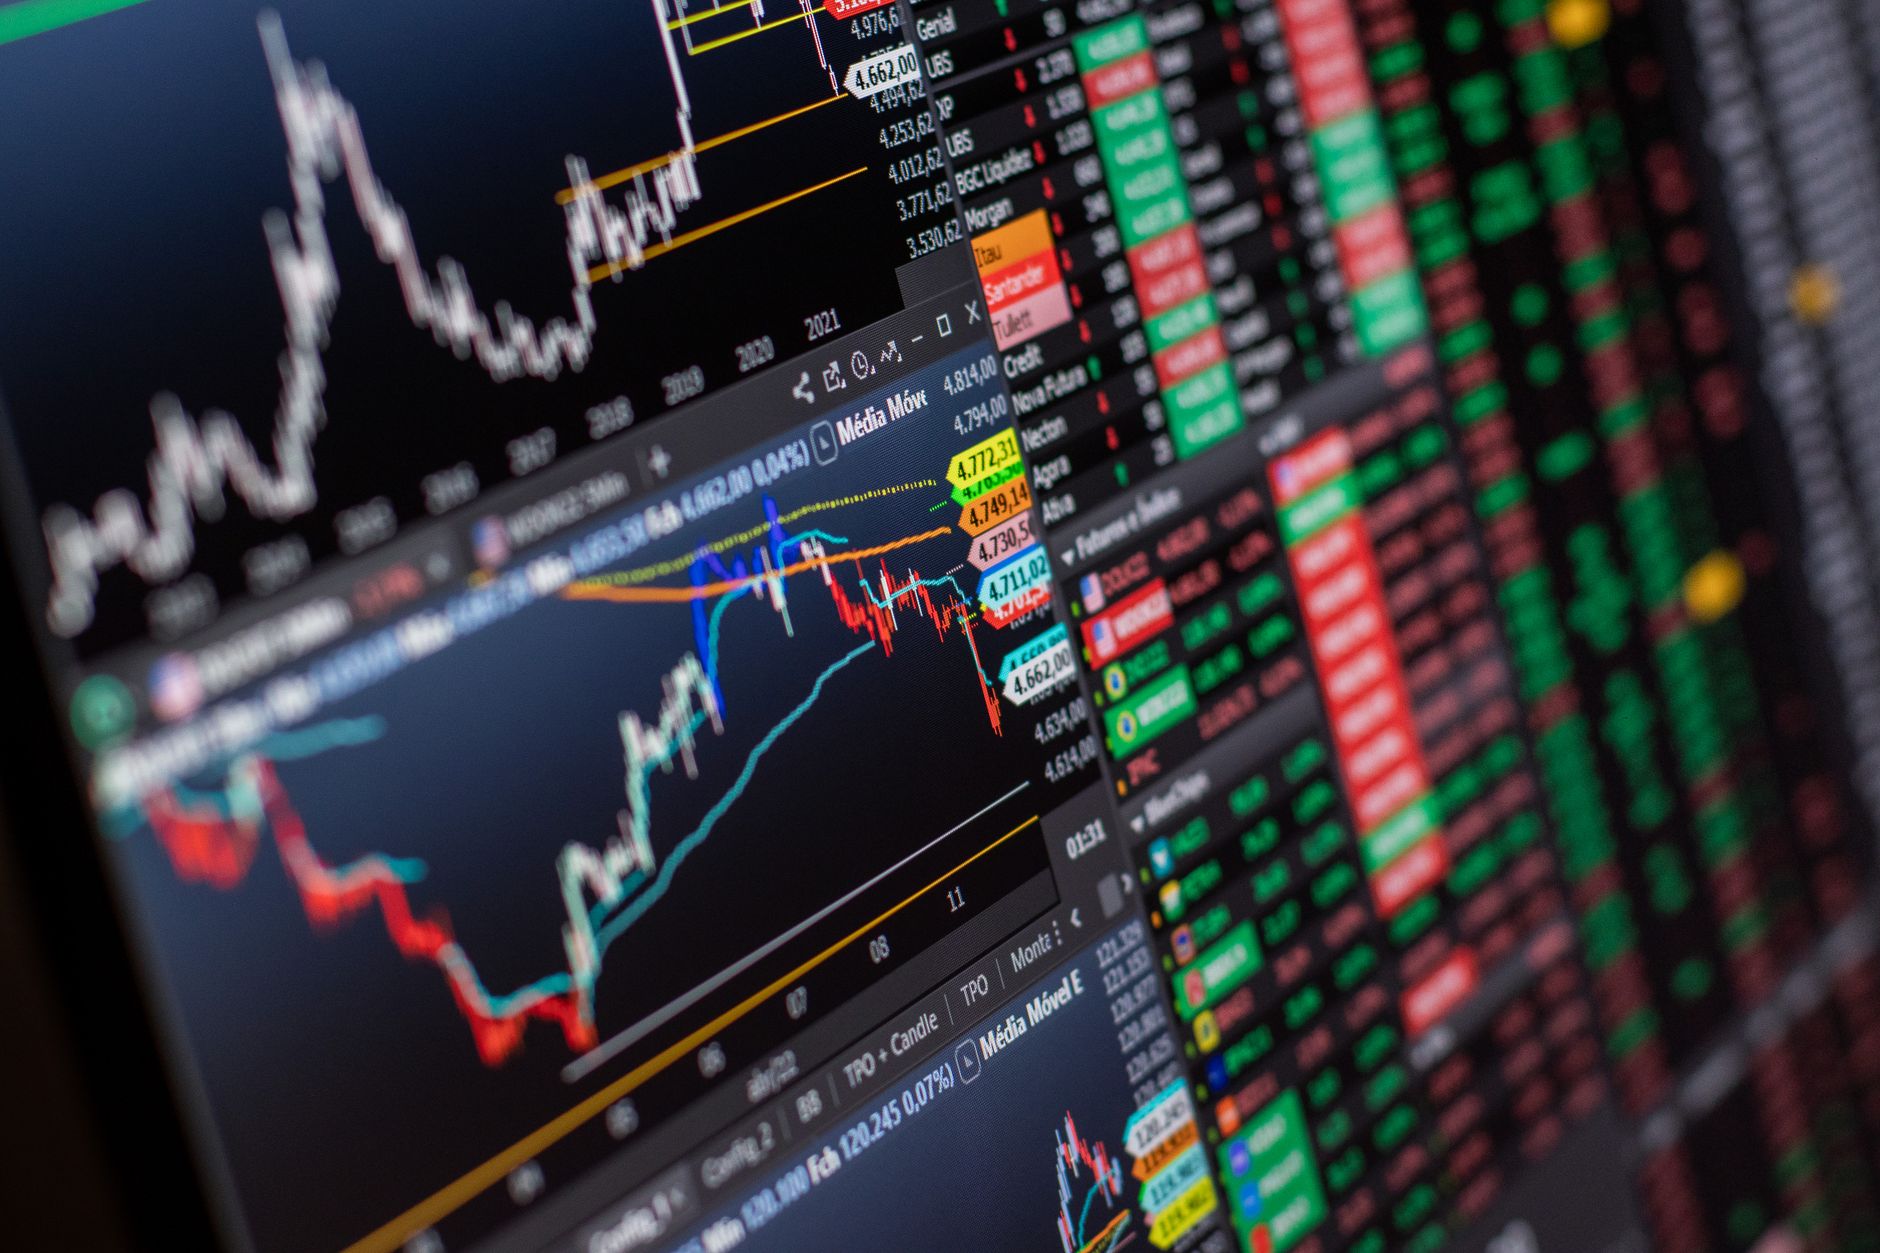
    Stop Repeating the Mistakes — Get a Structured Starting Point

    The best trading signals and tools for Australian traders in 2026 are mapped out in the JTVertex pillar guide. It is the practical companion to everything in this article.
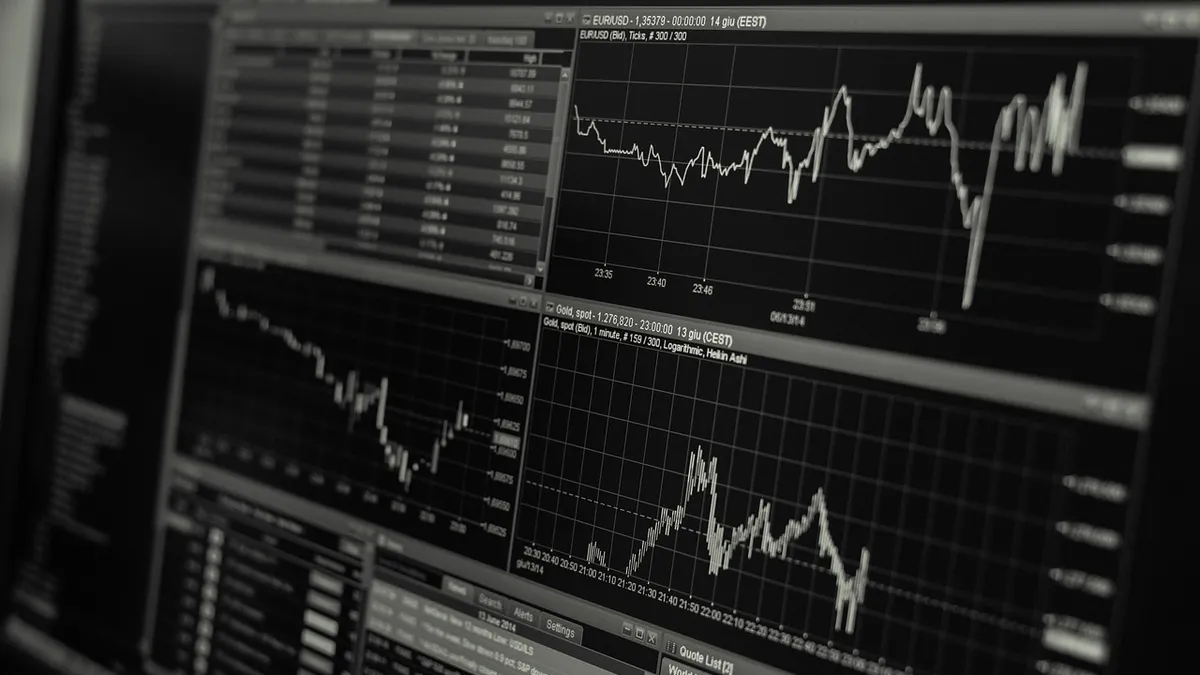
    Read the Full Signals Guide
    Mistake 1
    Treating the first signal they learn as universal

    After reading about MACD crossovers, many traders apply them to every instrument, every timeframe, every market condition. MACD was designed for trending markets. In a ranging, choppy market it produces false signals consistently. The book usually says this. The trader usually skips that part. We did exactly this in the first six months — applied a trend-following signal to a sideways AUD/JPY range and wondered why it kept failing.

    Mistake 2
    Ignoring the fee drag that signals cannot overcome

    ASIC’s data is unambiguous: $73 million of the $458 million in retail losses in FY2023–24 came from fees alone. Five per cent of clients who were otherwise profitable ended up in a net loss purely because of transaction costs. A signal with a 55% win rate sounds promising until you calculate whether the spread, commission, and overnight financing costs still leave you net positive. This arithmetic must happen before you trade any signal live, not after.

    Mistake 3
    Abandoning a signal after two losing trades

    Every signal system has losing streaks. A system with a 60% win rate will statistically produce runs of five consecutive losses. Traders who read about a signal, test it briefly, hit a losing streak, and abandon it — then repeat this cycle with the next signal — never accumulate the sample size needed to know whether the system actually works. This is called “system hopping” and it is one of the most reliable ways to stay unprofitable.

    Mistake 4
    Skipping the signals that do not look “clean”

    Books show perfect examples. Real charts are messy. Traders who only act on textbook-perfect signal formations miss the majority of tradeable setups. Worse, they develop a false confidence that their signal “only fails when it does not look right” — which is circular reasoning that protects the belief rather than tests it. The skill is learning to grade signal quality on a spectrum, not in binary terms.

    The evidence: ASIC Report 828 notes that among retail clients who traded more actively — 50 or more open positions per month — 19% of those who would otherwise have been profitable ended up in a net loss after fees in FY2023–24. Increased trading activity, without a corresponding improvement in signal quality and cost management, correlates with worse outcomes.

    James made Mistake 3 twice. The second time, he documented it in his trading journal — wrote down the exact thought process that led him to abandon a system after four losing trades. When he reviewed the journal six weeks later, the system had recovered and would have been profitable. That journal entry became the most expensive and most valuable lesson of his trading education.
    common mistakes applying trading signal book strategies in live markets Crazii JTVertex
    The gap between reading about signals and executing them consistently — and how to close it. · Photo: TheInvestorPost / Pixabay

    How Do Trading Signal Books Compare to Live Signal Services for Australian Traders?

    How Do Trading Signal Books Compare to Live Signal Services for Australian Traders?
    💡

    Key points: Books build the analytical framework that lets you evaluate any signal — including those from live services. Live signal services provide real-time application but offer no education. Used together, they serve different and complementary purposes. Used alone, each has a critical blind spot.

    You are reading this article, which means you are probably weighing whether to invest time in books or whether to just subscribe to a live signal service and skip the theory. That is a fair question. Let me answer it directly. Live signal services — including the copy-trading ecosystem on MetaTrader, which hosts over 3,200 signals — give you actionable outputs without requiring you to understand the underlying analysis. ASIC noted in Report 828 that 26,243 retail clients used copy trading in FY2023–24, reflecting genuine and growing interest. The appeal is obvious: you follow a provider, positions appear in your account, you do not need to analyse anything. The problem is that you also cannot evaluate anything. When the signal provider enters a drawdown — and every provider eventually does — you have no framework to determine whether the drawdown is within normal parameters or whether the strategy has fundamentally broken. Traders without foundational knowledge tend to exit copy-trading arrangements at exactly the wrong moment: after the drawdown, just before the recovery. Books give you that evaluation framework. They teach you to look at a signal provider’s track record and ask the right questions: How many trades in the history? We personally treat anything under 100 completed trades as statistically insufficient — that is my heuristic, not a rule, but it has kept me out of trouble more than once. What is the maximum drawdown? A drawdown above 20% is a flag worth investigating carefully. What market conditions did the provider trade in? A system built entirely in a trending 2020–2021 market may not survive a ranging 2024 environment.
    FactorTrading Signals BooksLive Signal Services
    Learning depthHigh — builds transferable frameworkNone — output only
    Time to applyWeeks to months of studyImmediate
    Ability to evaluate qualityDevelops this skill explicitlyRequires external framework
    CostOne-off book purchaseOngoing subscription or spread cost
    Risk of blind followingLow — you understand the logicHigh — especially in drawdowns
    Adaptability to market changesHigh — principles transferDependent on provider’s adaptability

    Expert tip: Crazii JTVertex’s actual workflow: we reads the book first, builds the conceptual model, then uses a live signal service as a real-time laboratory to test whether the concepts hold in current market conditions. The book is the map. The live service is the terrain. You need both — but the map comes first, otherwise the terrain is just noise.

    The traders who get the most from live signal services are the ones who already understand what the signals mean. That is not a coincidence. It is the reason the tool should come before the platform — which is the exact sequence Crazii JTVertex is built around. For a broader view of whether the forex side of this is worth pursuing in the Australian context, the analysis at Is Forex Trading Worth It for Australians covers the realistic picture without the hype. And for the full picture of signals and tools available to Australian traders right now, the best trading signals and tools for Australian traders in 2026 guide is the natural next step from this article.
    trading signals books versus live signal services comparison for Australian traders Crazii JTVertex
    Books versus live services: why the most effective traders use both, in the right order. · Photo: TheInvestorPost / Pixabay

    Frequently Asked Questions About Trading Signals Books

    Frequently Asked Questions About Trading Signals Books
    💡

    Key points: The questions traders ask most often about signals books reflect a common tension: wanting a shortcut to signal mastery while suspecting there is no such thing. The honest answer is that there is no shortcut — but there is a faster path, and it runs through deliberate, applied reading rather than passive consumption.

    What is the best trading signals book for an absolute beginner in Australia?

    Start with “Technical Analysis of the Financial Markets” by John J. Murphy. It covers every major signal category with enough depth to build a real framework. Follow it with “Trading in the Zone” by Mark Douglas once you have the mechanics — that sequence will save you months of confusion.

    Can a trading signals book replace a live signal service?

    No — they serve different purposes. A book builds the analytical framework to evaluate any signal. A live service provides real-time application. The most effective approach is to read first, then use a live service as a testing environment for what you have learnt. One without the other leaves a significant gap.

    How long does it take to apply what you learn from a trading signals book?

    Realistically, three to six months of deliberate practice — reading, charting historical examples, and documenting observations — before you have enough personal data to trade a signal with confidence. Anyone promising faster results is selling something. The ASIC data on retail losses reflects what happens when traders skip this stage.

    Are trading signals books still relevant when AI and algorithms dominate the market?

    The foundational principles — trend identification, momentum measurement, support and resistance — remain valid because they reflect how large institutional participants think about price. What has changed is the lower-timeframe environment, where algorithmic activity creates noise that classic signals struggle with. Books teach the principles; you apply judgement about timeframe and context.

    Who should NOT rely primarily on trading signals books?

    Traders who need immediate, real-time guidance in live markets should not rely on books alone — books are educational, not operational. Also, traders with no risk management framework in place should address that before applying any signal system. Reading without risk parameters is how signal knowledge becomes expensive.

    Ready to Move From Reading to Doing?

    Crazii JTVertex works with Australian traders who want to build a real foundation — not just collect books. If you want a conversation about where to start, the contact page is the right place.

    Get in Touch

    Note: This article contains general information only and is not personal financial advice. CFD trading and leveraged products carry significant risk of loss. ASIC Report 828 (January 2026) found that 68% of Australian retail CFD clients lost money in FY2023–24. Consider your personal circumstances and seek independent financial advice before making any trading decisions.