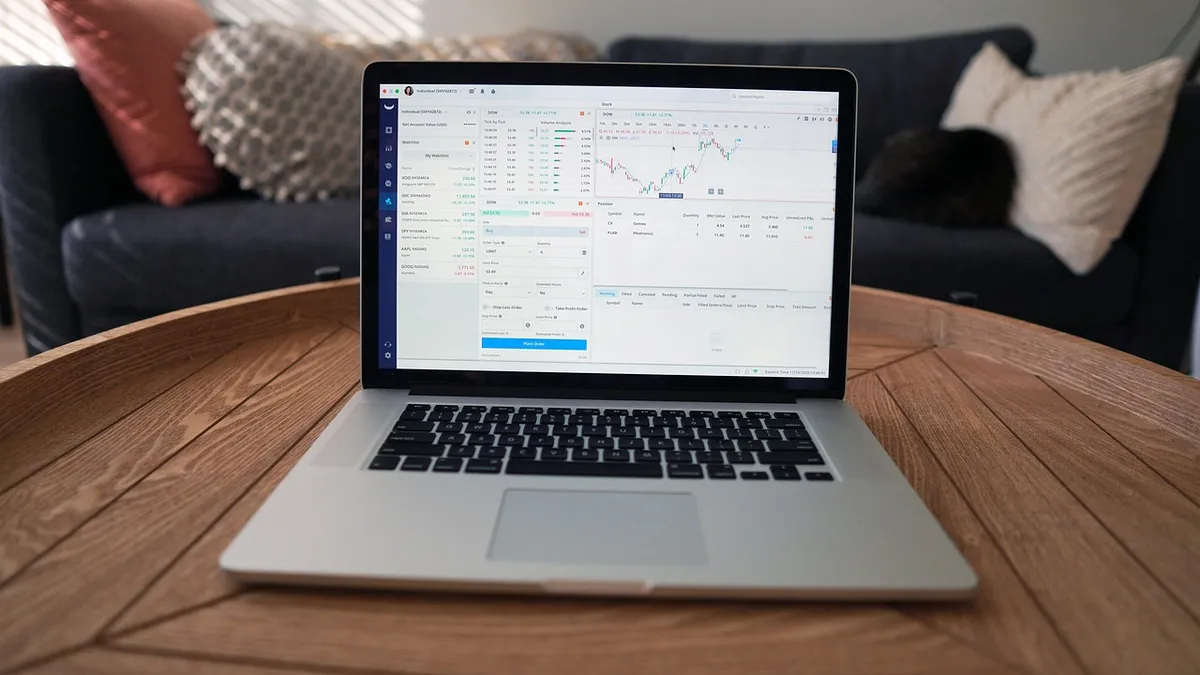
How to understand trading signals is the question that separates traders who blow their first account from those who actually survive long enough to learn. At Crazii JTVertex, we work directly with Australian traders navigating this exact moment — the one where a signal flashes green, your finger hovers over the button, and you genuinely have no idea whether to trust it. This guide on how to understand trading signals before risking real money will give you a working framework to read, filter, and act on signals with clarity — so the first dollar you put in is backed by something more than hope.
Here is the stake nobody says out loud: every week you spend trading signals you do not fully understand is a week you are essentially paying tuition to the market. According to ASIC’s Report 828, 68% of Australian retail CFD clients lost money in FY2023–24 — that is 133,674 people, with net losses exceeding $458 million in a single financial year. That is not a warning label. That is a description of what happens when traders skip the step you are about to take.
By the end of this article, you will know exactly what a trading signal is telling you, what it is hiding, and how to test one before a single dollar is at risk. That is the promise. Hold me to it.
Not sure where to start with trading tools?
Crazii JTVertex has put together a free resource hub for Australian traders — signals, tools, and the context to use them properly.
Explore the hubTable of contents
- 01 What is a trading signal and how does it actually work?
- 02 How do you read trading signal data without getting misled?
- 03 What is the science behind why trading signals fail?
- 04 What are the most common trading signal mistakes Australian traders make?
- 05 How do you test a trading signal before risking real money?
- 06 Frequently asked questions about understanding trading signals
What is a trading signal and how does it actually work?
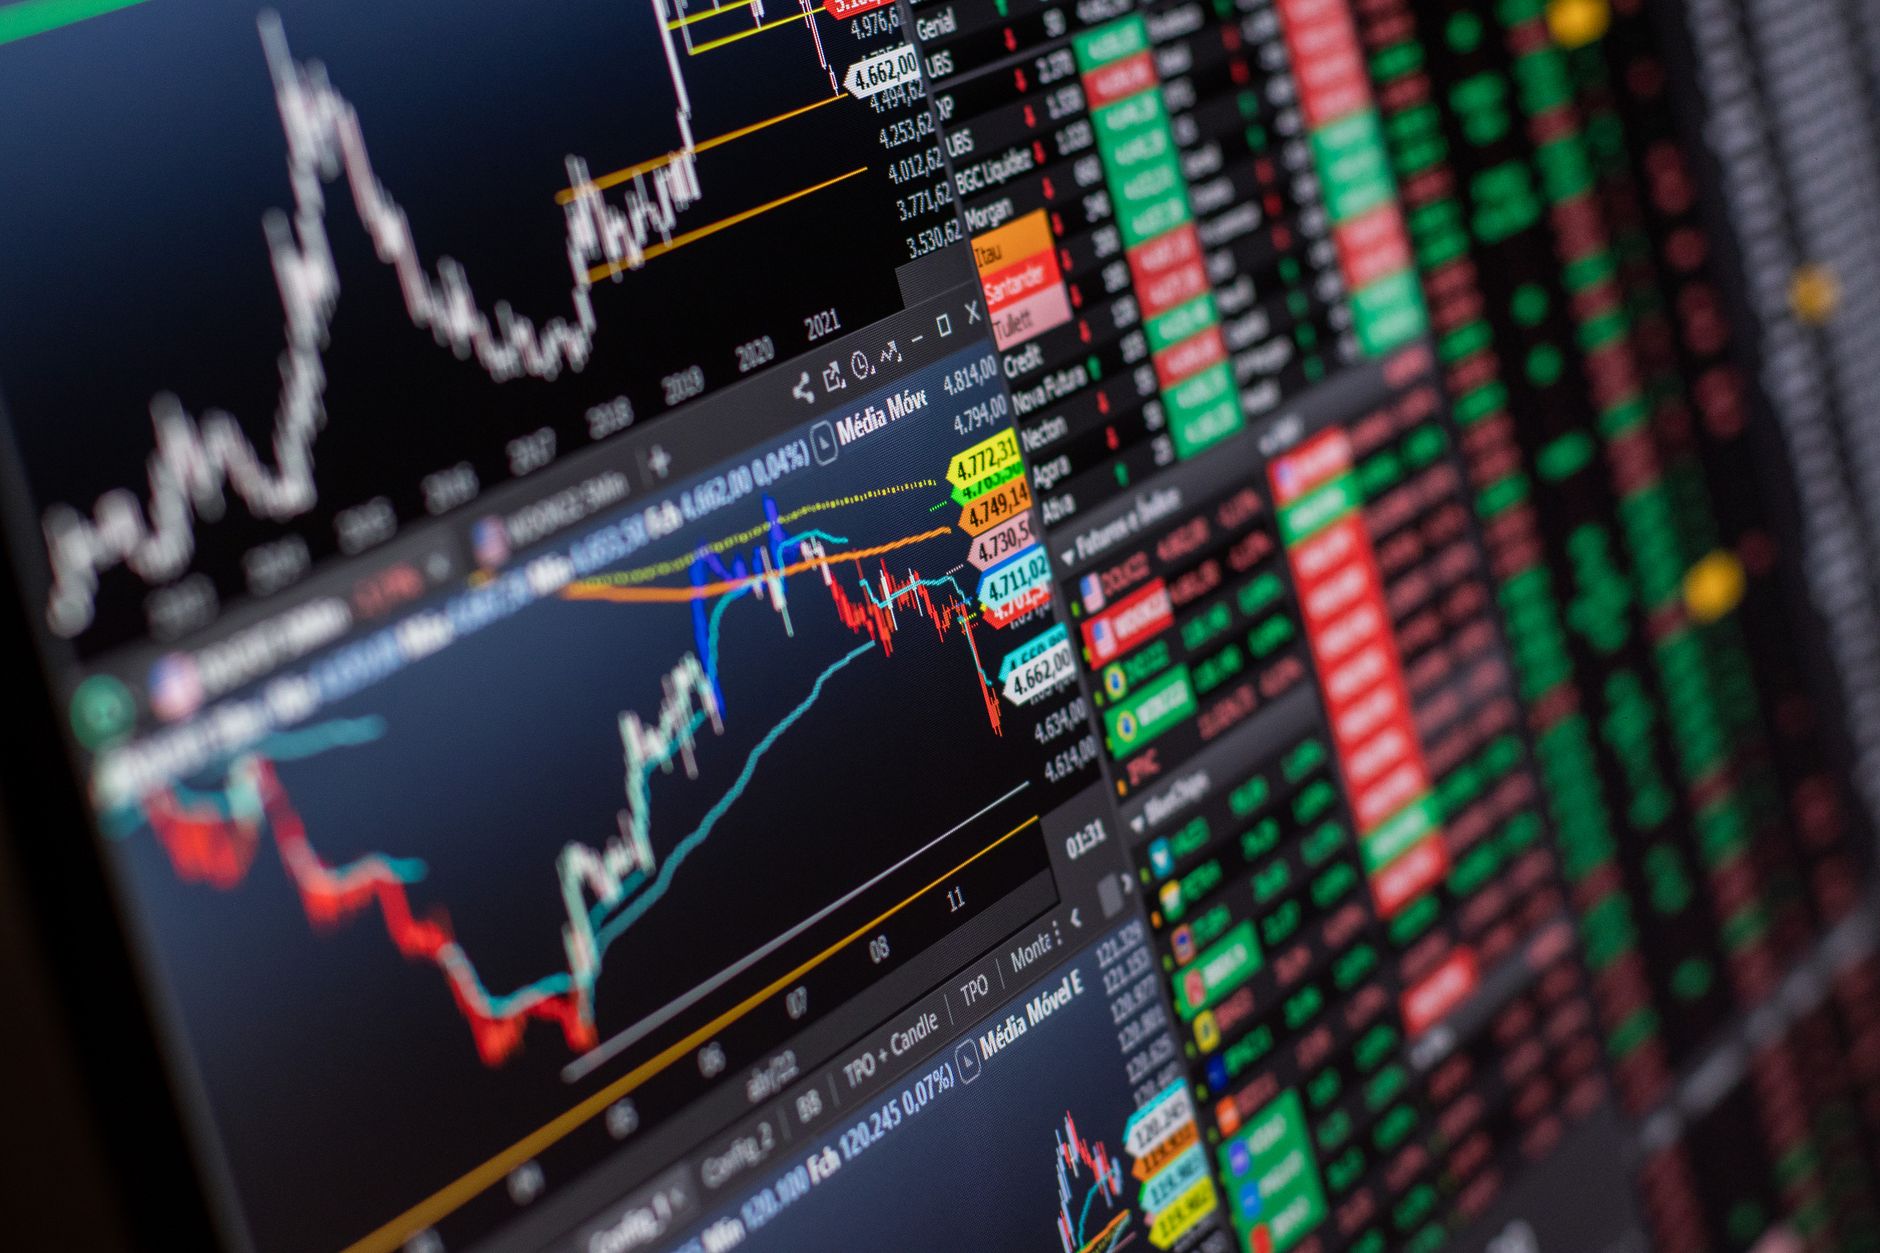
Key points: A trading signal is a data-driven prompt — generated by an algorithm, an analyst, or a combination of both — that suggests a specific action: buy, sell, or hold a given asset at a defined price and time. It does not guarantee profit. It is a structured opinion backed by a set of conditions.
The evidence: MetaQuotes reports that the MetaTrader platform hosts more than 3,200 free and commercial signal providers in its built-in marketplace. Volume alone tells you nothing about quality. The sheer number of available signals means the filtering work falls entirely on you.
Expert tip: Crazii JTVertex has reviewed dozens of signal providers, and the single most revealing question to ask is this — “What is your maximum consecutive losing streak?” Not win rate. Not monthly return. Consecutive losses. A provider who cannot answer that, or who has never tracked it, is operating on luck, not a system. Most providers will not volunteer this number. Ask for it directly.
Identify the signal type
Determine whether the signal is technical (chart-based), fundamental (news-based), or hybrid. Each type requires different context to evaluate and carries different timing risks.
Locate the entry logic
Find the specific conditions that triggered the signal. If the provider cannot explain the trigger in plain language, that is a red flag — not a style choice.
Check the risk parameters
Every legitimate signal includes a stop loss. If it does not, it is not a signal — it is a tip. Stop loss placement tells you more about a provider’s risk philosophy than their win rate ever will.
How do you read trading signal data without getting misled?

Key points: Reading signal data accurately means looking beyond win rate to metrics like risk-reward ratio, maximum drawdown, and the number of completed trades in the track record. A signal with a 90% win rate on 11 trades is statistically meaningless. One with a 58% win rate across 400 trades is worth examining.
The evidence: ASIC Report 828 (January 2026) found that among active traders placing 50 or more open positions per month, 19% of those who would otherwise have been profitable ended up in a net loss after fees. More trading frequency did not improve outcomes — it worsened them for a meaningful minority.
Expert tip: When minding reviews a signal dashboard, the first thing to look at is not the equity curve — it is the trade list, sorted by date. Look for gaps. A provider who stopped publishing results for three weeks and then resumed with a clean run almost certainly had a losing period they chose not to display. Gaps in the trade history are a quiet confession.
| Metric | What to look for | Red flag |
|---|---|---|
| Win rate | Meaningful only alongside risk-reward ratio | Quoted without context |
| Risk-reward ratio | Average win / average loss — aim for above 1:1 | Below 1:1 with high win-rate claims |
| Maximum drawdown | Largest equity decline from peak | Above 20% (author’s heuristic) |
| Sample size | Minimum 100 completed trades | Fewer than 50 trades in history |
| Trade history gaps | Continuous, date-stamped record | Missing weeks or unexplained pauses |
Want to see which signal tools are worth your time?
Crazii JTVertex has reviewed the leading options for Australian traders — with the metrics that actually matter, not just the marketing.
See the full reviewWhat is the science behind why trading signals fail?

Key points: Trading signals fail for three structural reasons: overfitting to historical data, changing market regimes, and execution gaps between the signal’s theoretical entry and the trader’s actual fill price. Understanding these mechanisms helps you set realistic expectations before a single trade is placed.
The evidence: ASIC Report 828 found that 74% of retail clients acquired through paid online advertising lost money in FY2023–24 — worse than the sector average of 68%. Traders drawn in by marketing tend to skip the evaluation steps that matter. The signal quality they encounter is often secondary to the urgency the marketing creates.
Expert tip: Minding has seen signal providers switch their displayed results from live trading to backtested data mid-way through a losing streak — without labelling the change. The tell is in the execution timestamps. Live trades have irregular fill times. Backtest results tend to show fills at the exact open of the candle, to the second. If every trade in the history shows a fill at 00:00:00 or 08:00:00 exactly, you are looking at a backtest, not a live record.
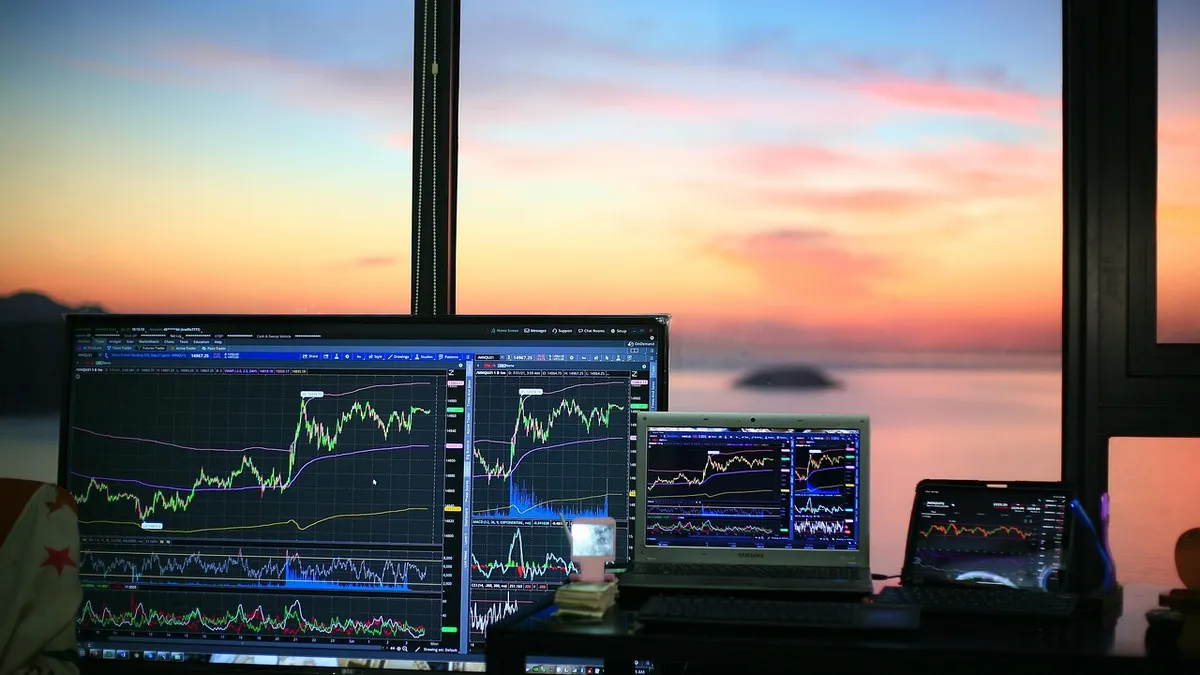
What are the most common trading signal mistakes Australian traders make?
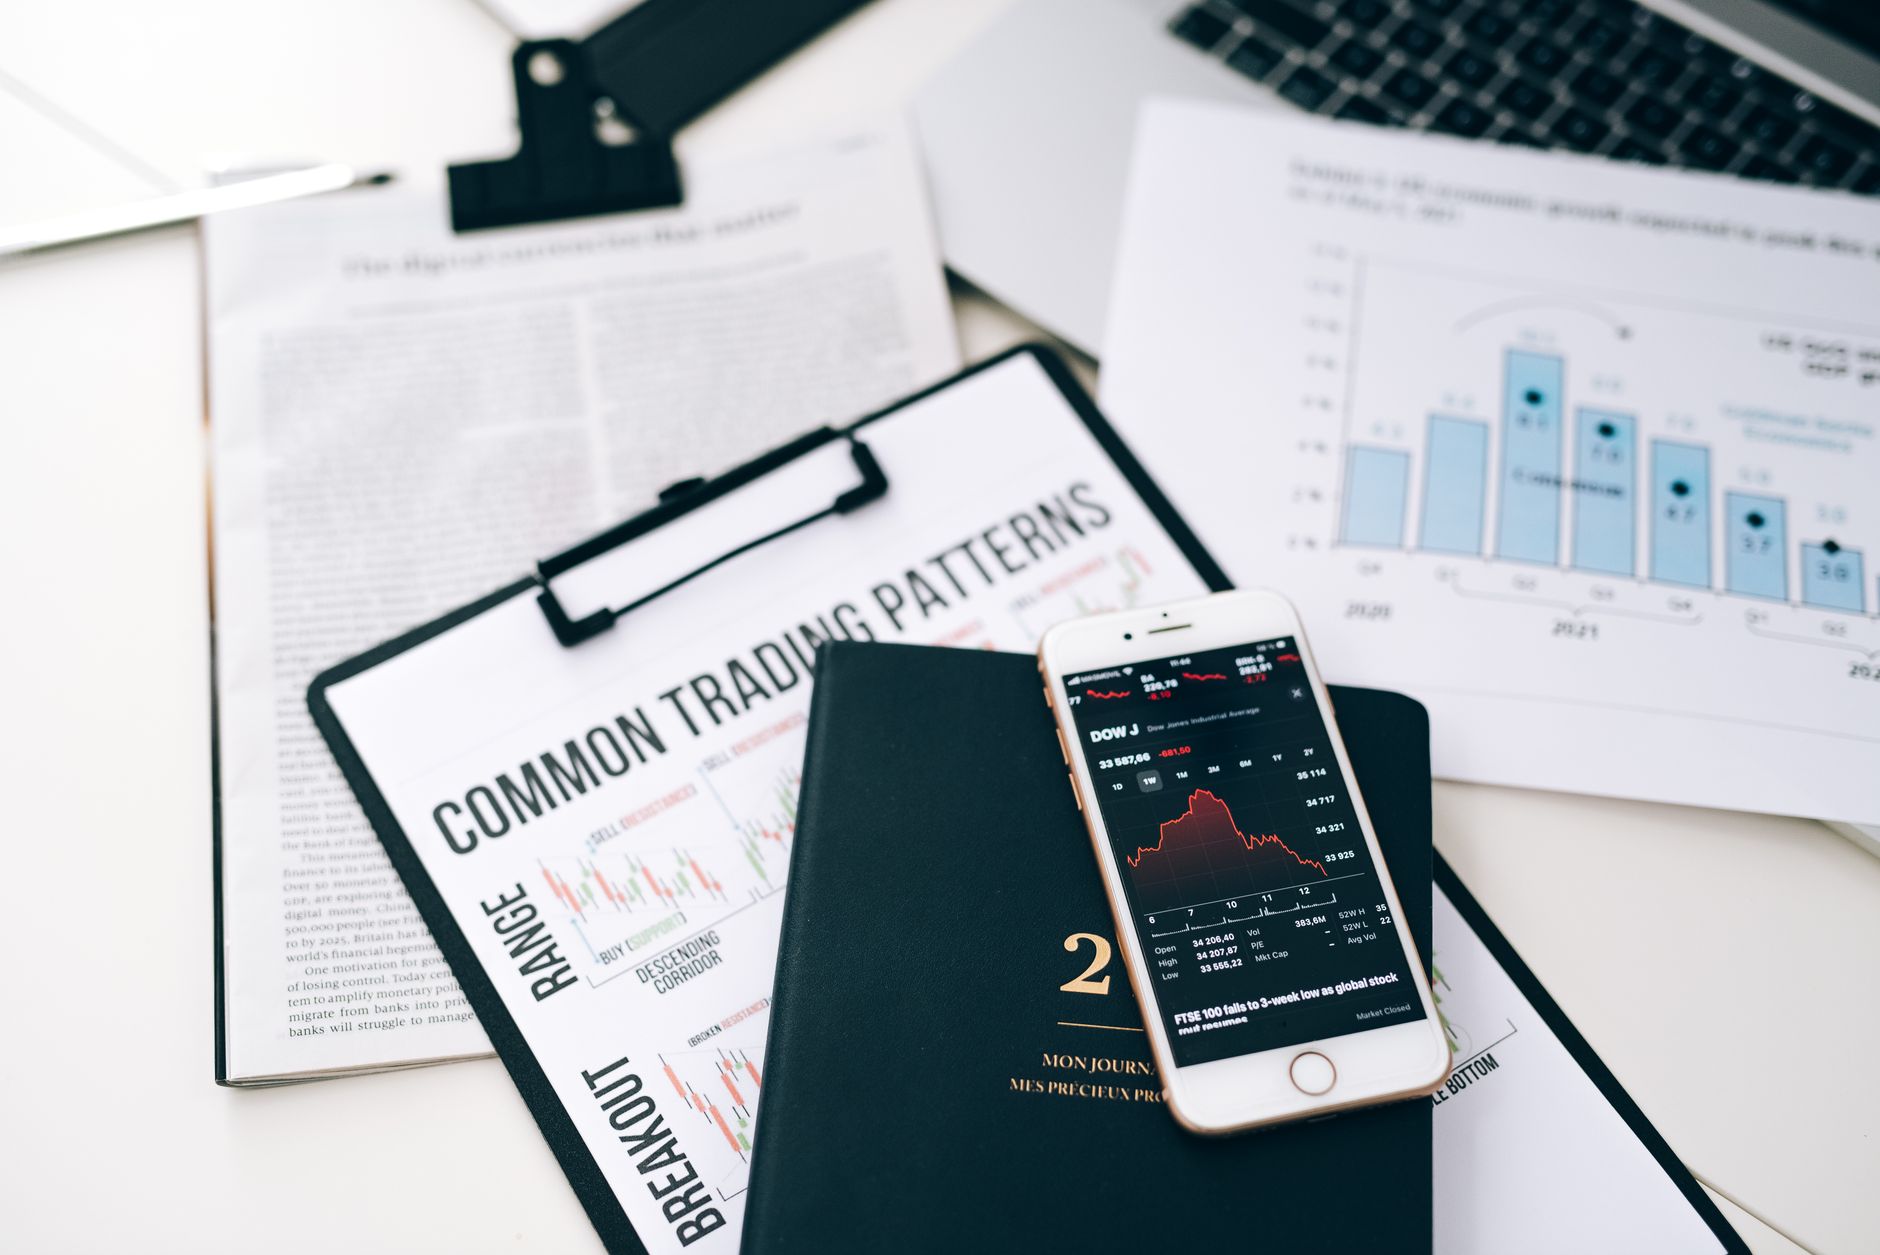
Key points: The most damaging mistakes traders make with signals are not technical — they are behavioural. Skipping the track record check, over-leveraging on a single signal, and abandoning a signal after one losing trade are the three patterns that turn a workable system into an expensive lesson.
A stop loss is not just a number — it is the signal provider’s statement about where the trade idea is invalid. If price hits the stop, the conditions that justified the trade no longer exist. Traders who move their stop loss further away to “give the trade more room” are not managing risk — they are overriding the signal’s core logic. At that point, they are no longer following a signal. They are improvising.
ASIC’s Report 828 noted 26,243 retail clients used copy trading in FY2023–24 — a growing segment. The misunderstanding most of them share is that copy trading removes the need to understand what is being copied. It does not.
When the provider you are copying enters a drawdown, you need to know whether that drawdown is within their normal operating range or a sign of a broken system. Without understanding the signal logic, you cannot make that call. You will either exit too early and miss the recovery, or hold too long and absorb a loss the provider eventually claws back — without you.
More signals do not mean more profit. ASIC’s data shows that among active traders placing 50 or more open positions per month, 19% of those who would have been profitable ended up in a net loss after fees. In plain terms: the more frequently you traded, the more likely fees were to erase your gains. A signal that fires 40 times a month is not four times better than one that fires 10 times. It may be four times more expensive.
The evidence: 85% of Australian retail clients lost money trading options CFDs in FY2023–24, according to ASIC Report 828. Options CFDs are frequently paired with aggressive signal services promising high returns. The loss rate is not a coincidence — it reflects the compounding of product complexity, leverage, and signal misuse.
Expert tip: The mistake Crazii JTVertex made early on — and it is embarrassing to admit — was increasing position size after three consecutive winning trades from a new signal provider. It felt like confirmation. It was survivorship bias. The fourth trade was the largest loss in that provider’s recorded history. Position sizing should be fixed and rules-based, never adjusted upward based on recent wins from a signal you have not yet fully validated.
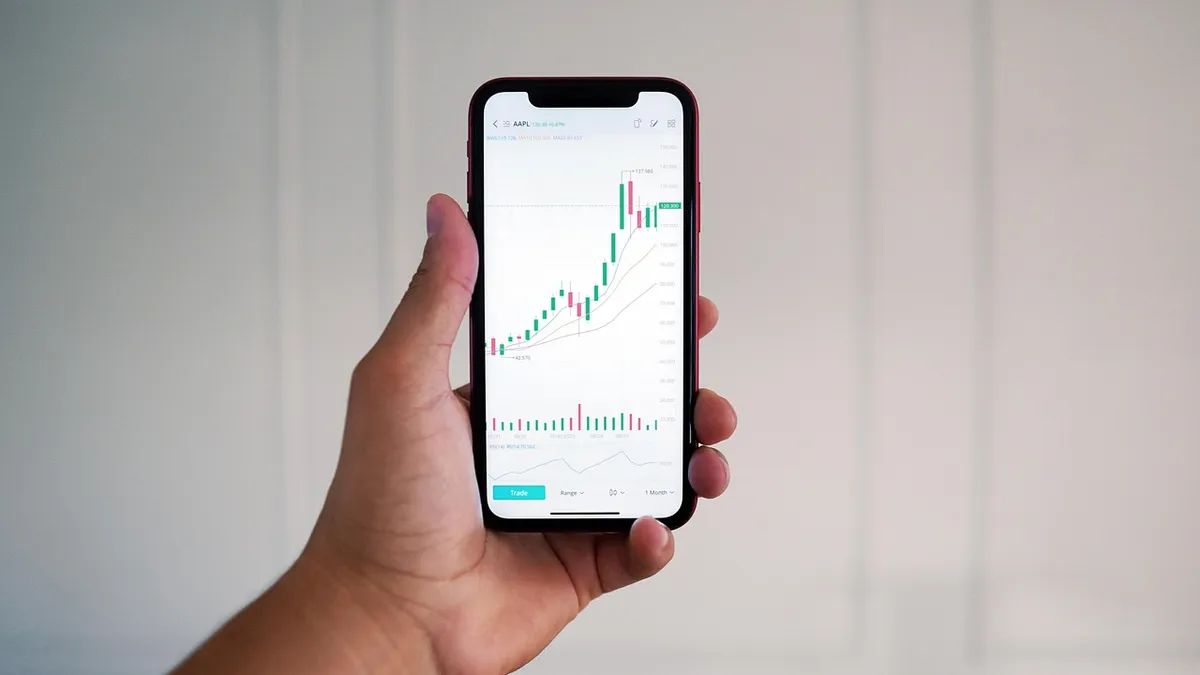
Ready to build a strategy around signals that actually fits your risk profile?
The Crazii community includes traders at every level — join the group to ask questions and see how others are approaching signal evaluation in the current market.
Join the groupHow do you understand trading signals well enough to test them before risking real money?

Key points: Testing a signal before committing real capital involves three stages: paper trading (simulated execution), forward testing on a demo account, and a controlled micro-lot live test. Each stage answers a different question about the signal’s viability for your specific situation.
The evidence: The full landscape of tools and signal providers available to Australian traders — including which platforms support proper demo testing environments — is covered in the pillar guide on best trading signals and tools for Australian traders in 2026, which consolidates the evaluation criteria discussed across this article.
Expert tip: During the demo phase, minding tracks not just P&L but “signal-to-execution delay” — the time between receiving the alert and placing the order. For most retail setups, that delay runs between 45 seconds and three minutes. In a fast-moving market, that gap can completely change the trade’s risk profile. If your delay consistently exceeds two minutes, you need either a faster alert system or a signal provider whose entries are limit orders, not market orders.
Paper trade for 20 signals
Log every signal in a spreadsheet before touching a platform. Confirm you can correctly identify entry, stop loss, and take profit without ambiguity.
Demo trade for 30+ signals
Execute in real time on a demo account with your intended broker. Track execution gaps and your emotional responses to drawdowns.
Micro-lot live test
Place real trades at minimum size. The goal is psychological calibration, not profit. Identify any behavioural patterns that differ from your demo results.
Frequently asked questions about understanding trading signals
Are trading signals suitable for complete beginners in Australia?
Signals can be a useful learning tool for beginners, but they are not a substitute for foundational knowledge. Without understanding the logic behind a signal, a beginner cannot distinguish a temporary drawdown from a broken system — and that distinction determines whether you hold or exit at the worst possible moment.
How many trades should a signal provider have before I consider following them?
As a personal heuristic, minding does not seriously evaluate any provider with fewer than 100 completed live trades. Below that number, the track record does not have enough data to distinguish skill from luck. This is the author’s working rule, not a statistical standard.
What is the difference between a trading signal and copy trading?
A trading signal is an alert you act on manually. Copy trading automatically replicates another trader’s positions in your account. Both carry the same underlying risks — the key difference is that copy trading removes the execution step, which also removes the opportunity to apply your own judgement about whether conditions are appropriate for your account size and risk tolerance.
Do Australian regulations affect how signal providers operate?
Yes. ASIC regulates financial services in Australia, and providers offering signal services that constitute financial advice must hold an Australian Financial Services Licence. Traders should verify whether a signal provider is ASIC-licensed or operating under an exemption before subscribing. Unlicensed providers offering what amounts to personal financial advice are operating outside the law.
How long should I demo trade a signal before going live?
A minimum of 30 completed trades or four weeks of real-time testing, whichever comes first. The goal is not just to assess profitability — it is to understand the signal’s behaviour across different market conditions and to calibrate your own execution process before real capital is at stake.
Want a second set of eyes on your signal evaluation process?
Reach out directly — Crazii JTVertex works with Australian traders at every stage, from choosing the right tools to building a testing framework that fits your schedule and risk profile.
Get in touchNote: This article contains general information only and does not constitute personal financial advice. Trading CFDs, margin FX, and related instruments involves significant risk of loss. ASIC’s Report 828 found that 68% of Australian retail CFD clients lost money in FY2023–24. You should consider your own financial circumstances, objectives, and risk tolerance, and read all relevant Product Disclosure Statements and Target Market Determinations before trading. If you are uncertain, seek advice from a licensed financial adviser.
Leave a Reply