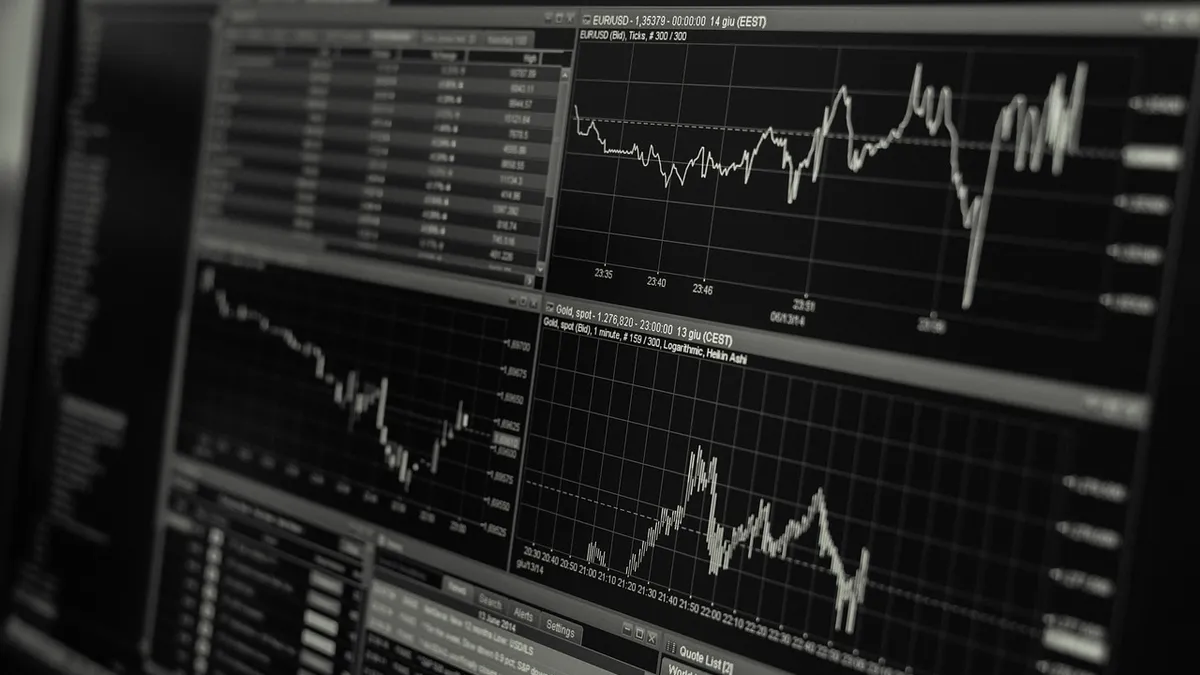
Tag: how to build a trading strategy

  • How to Build a Trading Strategy That Survives a Bear Market

    How to Build a Trading Strategy That Survives a Bear Market

    Learning how to build a trading strategy that actually holds up when markets turn ugly is the difference between surviving a bear market and watching months of gains disappear in a fortnight. At Crazii JTVertex, we have worked with Australian traders at every level — from those placing their first CFD trade to those managing five-figure accounts — and the pattern is always the same: the traders who endure downturns built their strategy before the crash, not during it. This article will walk you through exactly how to construct a bear-market-resilient trading strategy, step by step, so that by the time you finish reading you will have a clear framework you can start applying this week. That is the promise. We will close it at the end.

    Note: This content is general information only and does not constitute personal financial advice. Trading CFDs and margin FX products carries significant risk. You should consider your own financial circumstances and read all relevant Product Disclosure Statements before trading. If in doubt, seek advice from a licensed financial adviser.

    Not sure where to start with trading tools?

    Crazii JTVertex has put together a free resource hub for Australian traders — signals, tools, and community support in one place.

    See the 2026 Trading Tools Guide
    Table of contents

    What does it actually mean to build a trading strategy for a bear market?
    What does it actually mean to build a trading strategy for a bear market?
    💡

    Key points: A bear-market trading strategy is a structured, rules-based plan that defines entry, exit, position sizing, and risk limits specifically for falling or volatile markets. It is built before conditions deteriorate — not as a reaction to them — so decisions are made on logic, not fear.

    Picture this: it is a Tuesday afternoon in late 2022, and a trader named Marcus — 34, based in Brisbane, working as a project manager — is watching his open positions bleed red across three screens. He had a plan for a bull run. He had no plan for this. Most traders build strategies for the market they want, not the market they have. That is the core mistake. A bear market does not announce itself with a polite warning; it arrives when sentiment shifts, liquidity dries up, and the signals that worked beautifully six months ago start firing false positives at an alarming rate. So what is a bear-market trading strategy, actually? It is a documented, rules-based framework that answers five questions before any position is opened: What am I trading? Under what conditions do I enter? Where is my stop? How much of my account am I risking on this single trade? And at what point do I stop trading entirely and step back? The word “documented” matters more than most traders realise. A strategy that lives in your head is not a strategy — it is a preference. Preferences evaporate the moment a position moves against you and your palms start sweating. Bear markets also change the statistical environment your strategy operates in. Correlations between assets that normally behave independently tend to spike. Volatility expands. Spreads widen. If your strategy was calibrated on calm, trending conditions, it will produce different outcomes — often worse ones — when those conditions vanish.

    The evidence: According to ASIC’s Report 828 (published January 2026, covering FY2023–24), 68% of retail CFD clients in Australia lost money over the financial year — that is more than two in three traders. In raw numbers, 133,674 retail clients recorded net losses exceeding $458 million. That figure includes $73 million in fees alone. In other words, for every three Australian traders you know, statistically two of them ended the year behind.

    Expert tip: Crazii JTVertex has reviewed hundreds of trader setups, and the single most consistent gap is this: traders define their entry rules in detail but leave their exit rules vague. “I’ll exit when it looks bad” is not an exit rule. The moment you are under pressure, “looks bad” becomes “looks catastrophic” — and by then the loss is already locked in. Write your exit rule before you write your entry rule. Always.

    1

    Write down your strategy — every rule, every condition

    Open a document right now. Not a spreadsheet, not a mental note. A document. Write the five questions above and answer each one in plain language. If you cannot answer all five, you do not yet have a strategy — you have a trading idea.

    2

    Stress-test your assumptions against falling-market conditions

    Look at your entry signals. Now ask: would these signals have triggered during the ASX downturn of early 2020 or the rate-hike selloffs of 2022? If your strategy has never been applied mentally to a bear scenario, it has not been built for one.
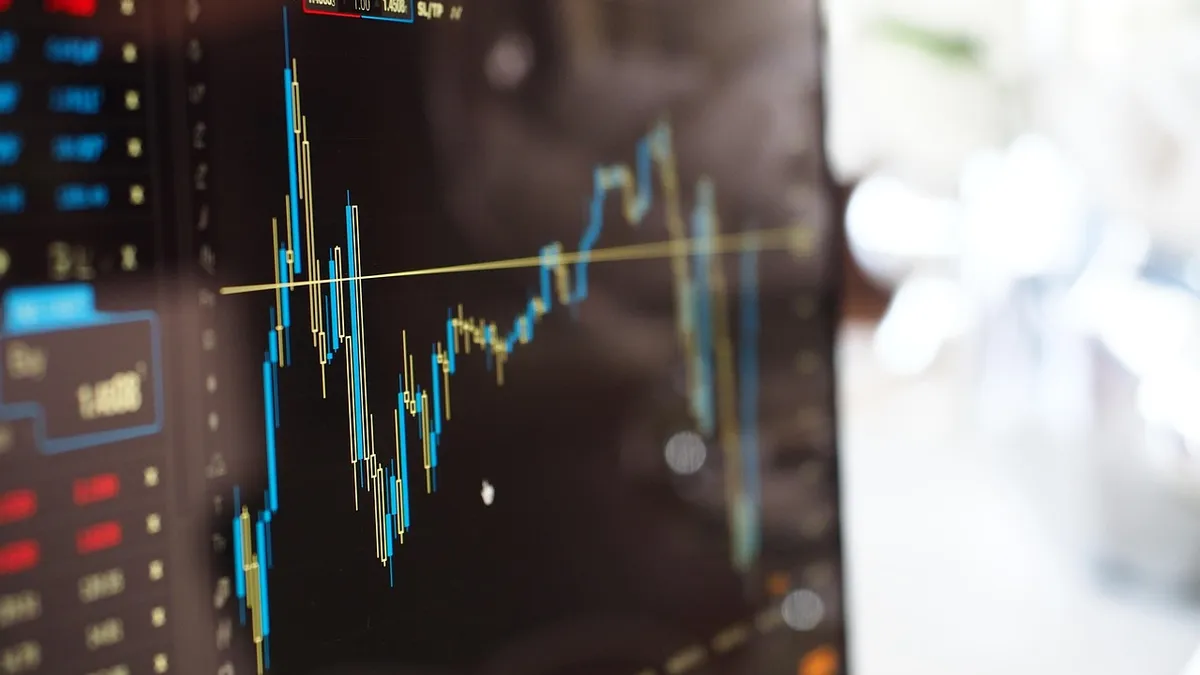
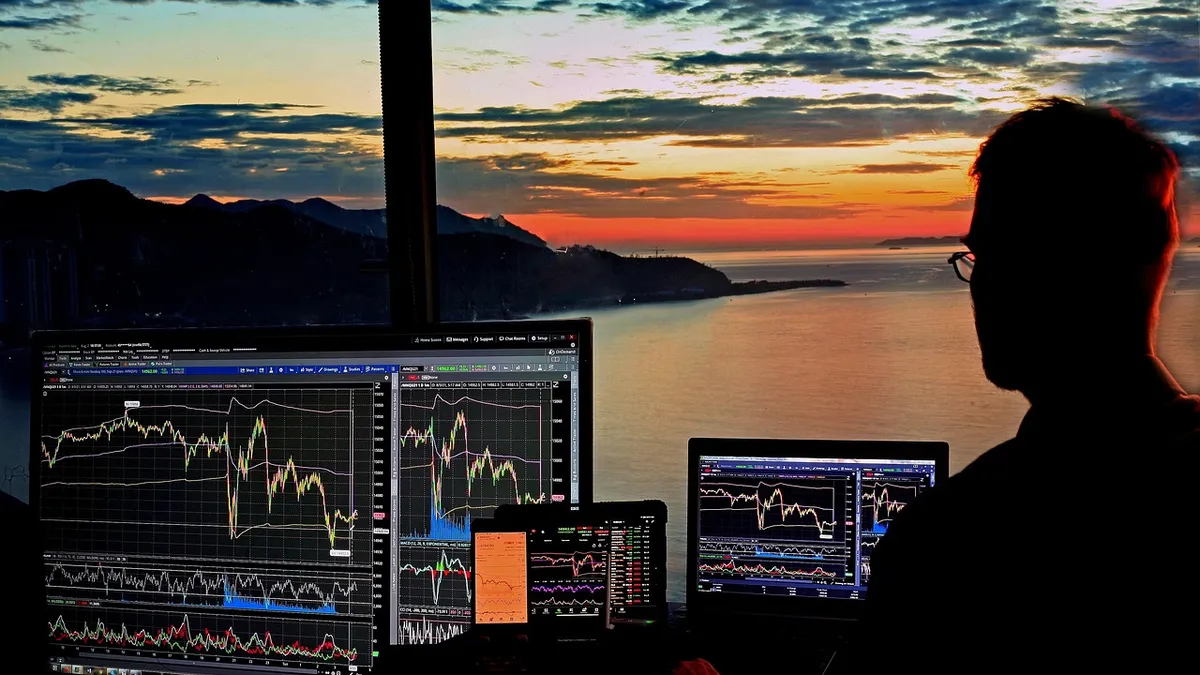
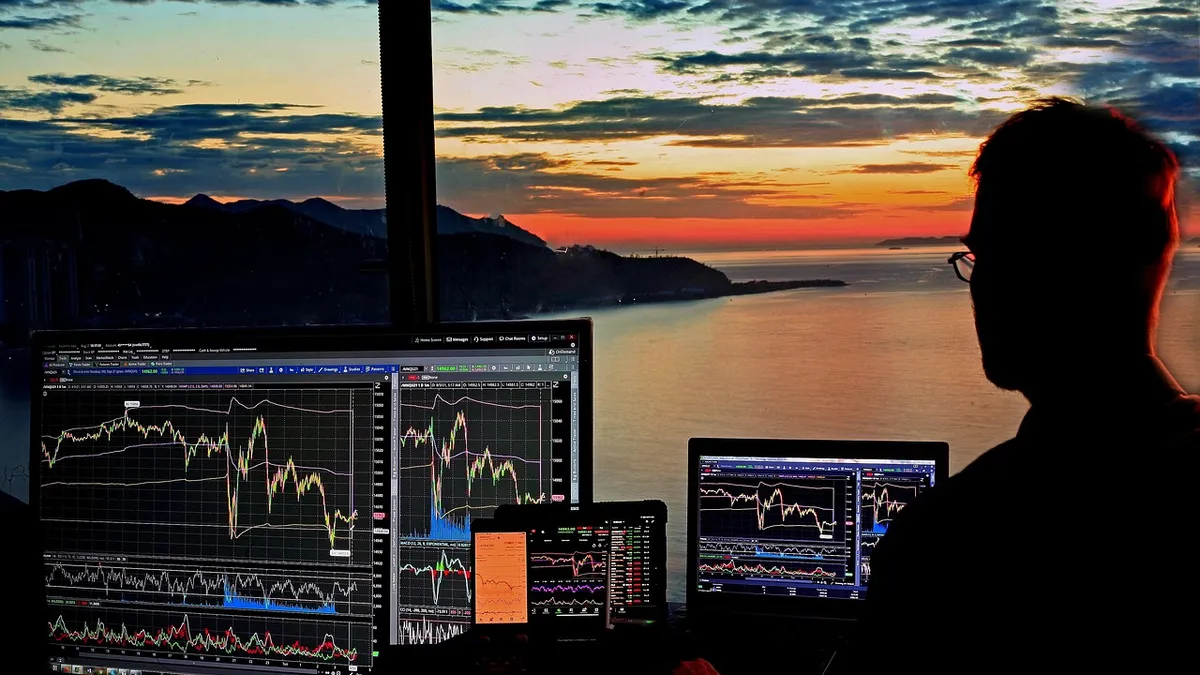
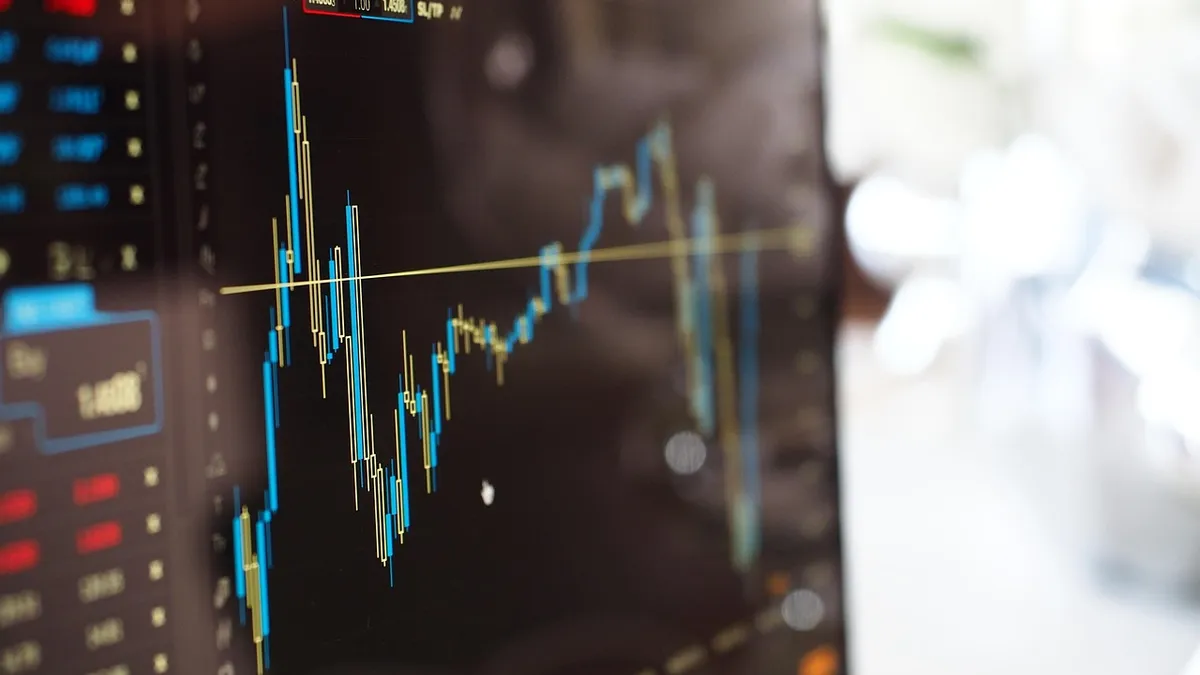
    how to build a trading strategy for a bear market — Crazii JTVertex
    A rules-based trading strategy built before market conditions deteriorate — the foundation of bear-market resilience. · Photo: Pexels / Pixabay
    The next section is where most traders get uncomfortable. Because defining risk parameters means putting a hard number on how much you are willing to lose. And almost nobody wants to do that before they have to.

    How do you define your risk parameters before a single trade is placed?

    How do you define your risk parameters before a single trade is placed?
    💡

    Key points: Risk parameters are the numerical limits — per-trade risk, maximum drawdown, and daily loss cap — that prevent a bad day from becoming a blown account. In a bear market, these numbers must be set more conservatively than in trending conditions, because volatility amplifies both gains and losses.

    Here is the question Marcus asked himself after that Tuesday in 2022: “If I had known the market was going to do this, what would I have done differently?” The answer, when he was honest, was simple. He would have traded smaller. He would have set a daily loss limit. He would have stopped. Risk parameters are not about being timid. They are about staying in the game long enough for your edge to play out. The first parameter to set is per-trade risk — the maximum percentage of your account you are willing to lose on any single position. A common personal heuristic used by Crazii JTVertex is keeping this figure below 2% of total account equity per trade. That is not a statistic from a study; it is a working rule that has been refined through watching what happens when traders exceed it during volatile periods. When you risk 5% or 10% per trade, three consecutive losses — which is entirely normal in any strategy — can remove 15–30% of your account. That kind of drawdown changes how you think. It makes you hesitate on valid signals and chase on invalid ones. The second parameter is maximum drawdown. This is the total account decline at which you stop trading and review. In a bear market, minn suggests setting this lower than you would in a bull environment — not because you expect to hit it, but because hitting it in a bear market without a review process is how accounts go to zero.

    The evidence: ASIC Report 828 found that among active traders who opened 50 or more positions per month, 19% of those who would otherwise have been profitable ended up losing money after fees. More trading, more fees, worse outcomes. This is not a coincidence — it is a structural reality of leveraged products. Trading less, but with more precision, is not a conservative choice. It is a mathematical one.

    The third parameter — and the one most traders skip — is a daily loss cap. This is the point at which you close everything and do not trade again until the next session. It sounds simple. It is extraordinarily hard to follow when you are down and convinced the market is about to reverse. Set it before the session starts. Write it down. Honour it.

    Expert tip: Crazii JTVertex has noticed something specific that rarely gets discussed: the worst trades of the day almost always happen in the 20 minutes after a stop-loss is hit. That is when the urge to “get it back” is strongest and judgment is weakest. The daily loss cap is not just a financial limit — it is a psychological firewall. Once it is hit, the session is over. No exceptions, no “just one more”.

    Risk Parameter Bull Market Setting Bear Market Adjustment Why It Changes
    Per-trade risk Up to 2% of account 1% or lower Wider spreads, faster moves amplify losses
    Max drawdown before review 15–20% of account 10% or lower Recovery is slower in falling markets
    Daily loss cap 3–5% of account 2–3% of account Volatility makes revenge trading more damaging
    Position count Multiple concurrent Fewer, higher conviction Correlations spike; diversification benefit shrinks
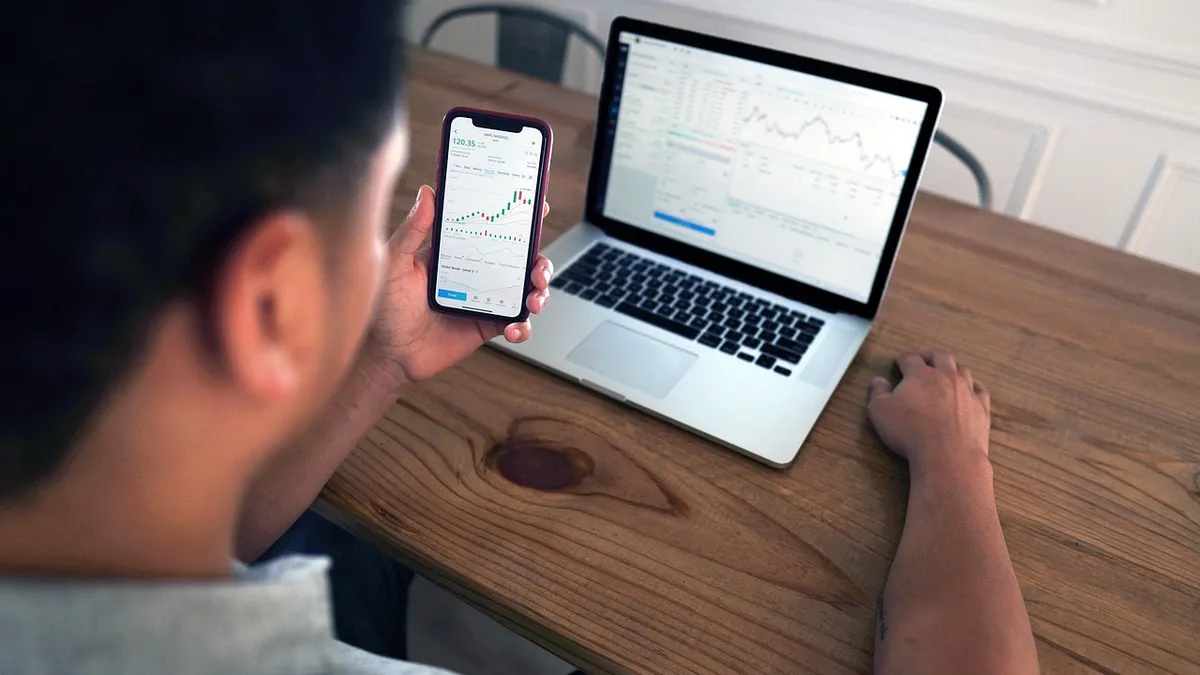
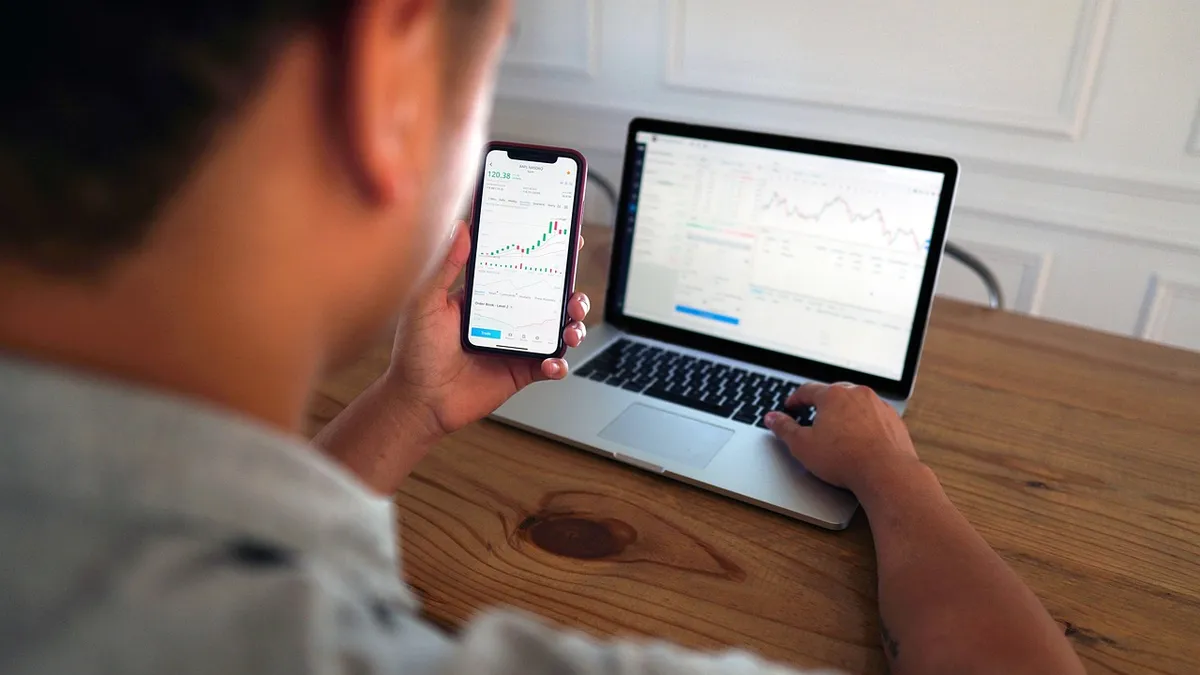
    trading risk management parameters for bear market conditions — Crazii JTVertex
    Risk parameters define the boundaries of every trade — set them before the market moves, not after. · Photo: sergeitokmakov / Pixabay
    Now that you have your risk framework, the next question is what you actually trade on. Which signals and tools belong inside a strategy that is designed to survive a downturn?

    Want a structured approach to trading signals?

    The best trading signals and tools for Australian traders in 2026 — curated by Crazii JTVertex for the local market.

    View the full guide

    Which trading signals and tools belong in a bear-market strategy?
    Which trading signals and tools belong in a bear-market strategy?
    💡

    Key points: In a bear market, momentum indicators and trend-following signals need to be paired with volatility filters and confirmation tools. Signals that work in trending upward conditions often produce false entries in choppy, declining markets. Choosing the right combination — and knowing which to ignore — is as important as the signals themselves.

    Not all signals are created equal. And in a bear market, the gap between a good signal and a misleading one widens considerably. The RSI (Relative Strength Index) is a useful starting point. Its standard oversold threshold is 30 and overbought is 70 — those are the correct Wilder parameters, not adjusted versions. In a bear market, price can stay below 30 for extended periods without bouncing meaningfully. This is what traders call a “momentum divergence trap” — the indicator says oversold, the trader buys, the market continues lower. Using RSI alone in a bear market is like using a compass in a magnetic storm. It gives you a reading, but you need to verify it against something else. What does “something else” look like in practice? A moving average crossover to confirm trend direction. A volume filter to check whether a move has conviction behind it. A volatility measure — such as Average True Range — to understand whether the current price action is within normal fluctuation or represents a genuine breakout. For Australian traders exploring signal sources, the MetaTrader platform hosts more than 3,200 free and commercial signals through its built-in marketplace. That is a large number. It does not mean all of them are appropriate for bear-market conditions. Minn’s personal heuristic — and this is a heuristic, not a rule — is to ignore any signal provider with fewer than 100 completed trades in their track record. Below that threshold, the sample size is too small to distinguish skill from luck.

    The evidence: ASIC Report 828 noted that 26,243 retail clients in Australia used copy trading services in FY2023–24. That is a growing number. But copy trading does not remove risk — it transfers the decision-making to another trader whose strategy may not be designed for the conditions you are currently in. If you are using copy trading as part of your strategy, understanding who gives the best trading signals and whether you can actually trust them is not optional — it is foundational.

    Marcus — our Brisbane trader from earlier — made a specific mistake here. He was following three signal providers simultaneously, all of whom had strong records in 2021. When conditions shifted, all three started generating losses at the same time. The signals were correlated. He had diversified across providers without diversifying across strategies or market conditions.

    Expert tip: Crazii JTVertex recommends checking whether a signal provider’s drawdown periods coincide with broad market selloffs. If every major loss in their track record happened during the same weeks as the ASX or S&P 500 declining sharply, their strategy is likely long-biased. That is not inherently wrong — but it means their signals will perform worst precisely when a bear market is at its most intense. Match your signal source to the conditions you are preparing for.
    For traders wanting to understand signal quality more deeply, what trading signals are and why traders use them is worth reading before committing to any provider. And if you are looking at community-based signal sources, the best trading signals Discord servers that active traders actually trust covers the landscape in detail.
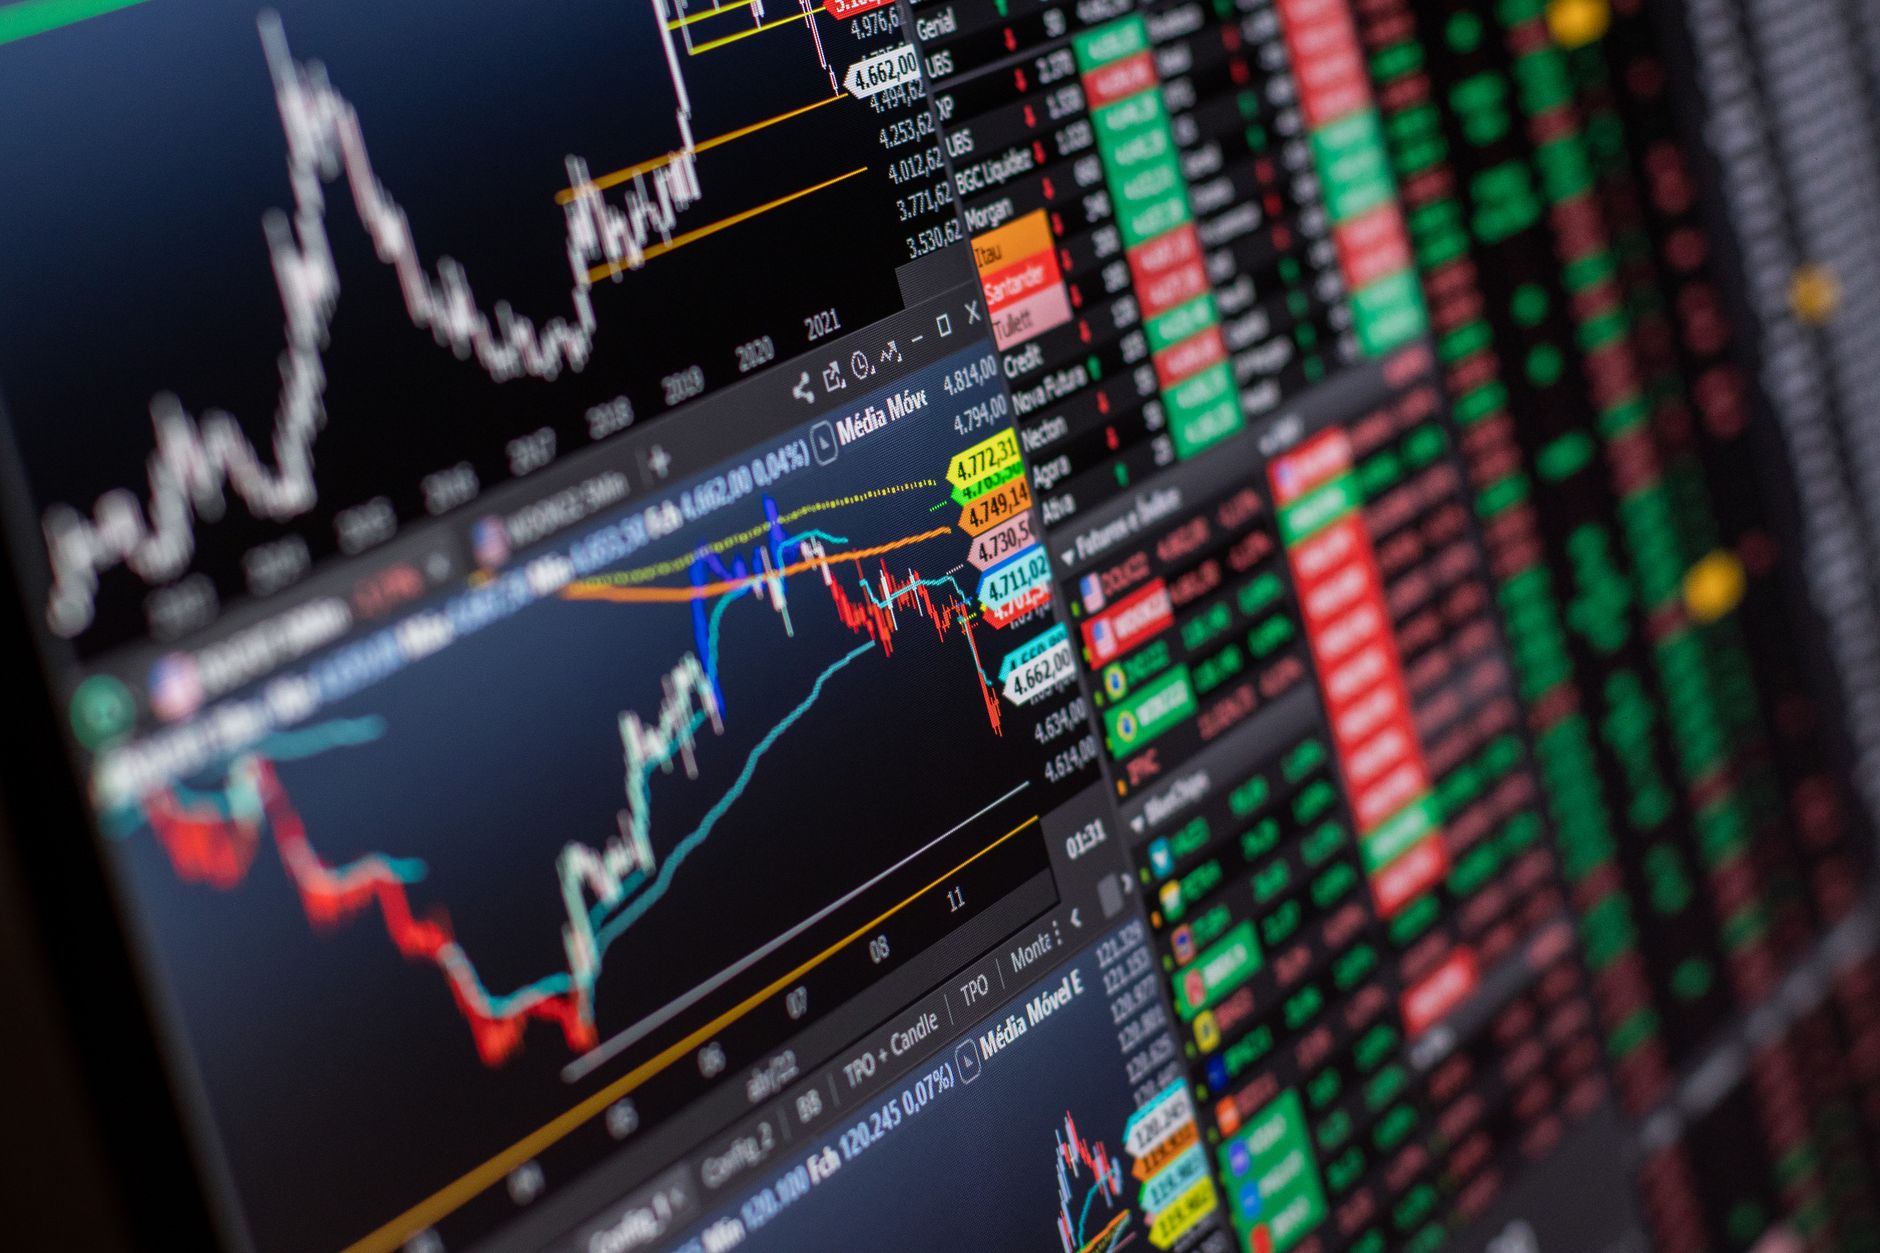
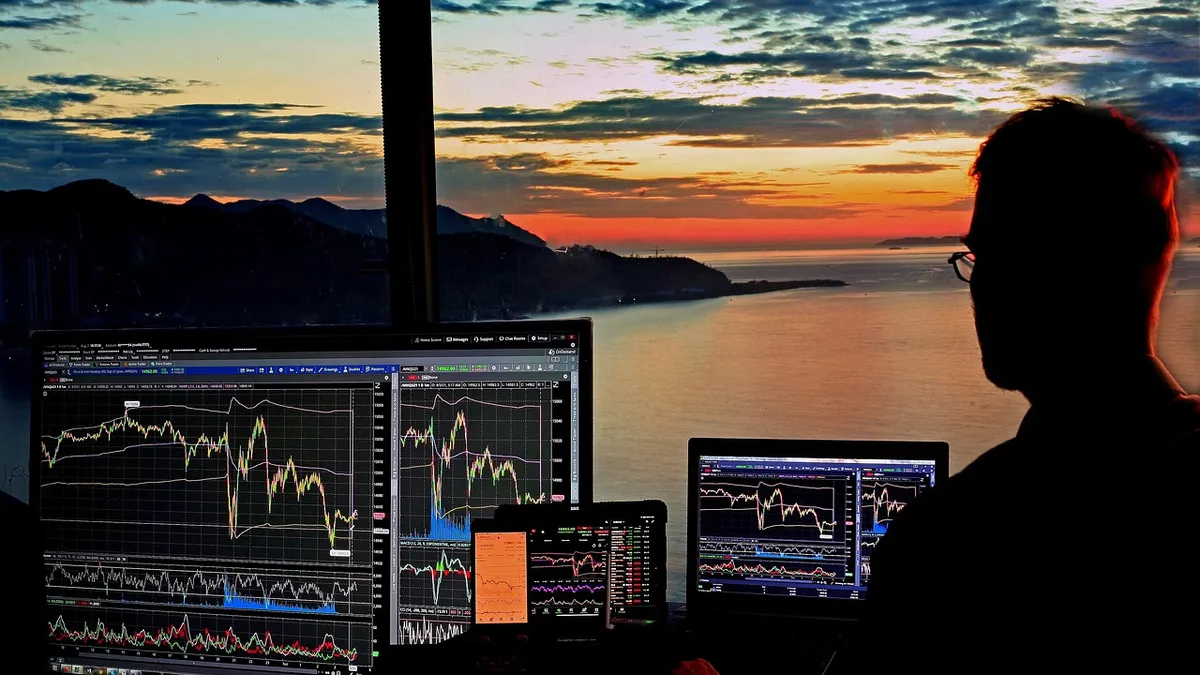
    trading signals and tools for bear market strategy — Crazii JTVertex
    Pairing RSI with volume and volatility filters reduces false signals during bear market conditions. · Photo: sergeitokmakov / Pixabay
    Knowing which tools to use is half the picture. The other half is knowing which mistakes will undermine your strategy even when the tools are right.

    What are the most common mistakes traders make when building a strategy in a downturn?

    What are the most common mistakes traders make when building a strategy in a downturn?
    💡

    Key points: The most damaging bear-market strategy mistakes are not technical errors — they are behavioural ones. Overtrading, abandoning rules under pressure, and copying strategies built for different conditions are the three patterns that consistently destroy accounts when markets fall.

    You might be reading this thinking: “I know about these mistakes already.” That is exactly when they are most dangerous. The traders who blow accounts in bear markets are not beginners who did not know the rules. They are experienced traders who knew the rules and broke them anyway — because the pressure of a falling market makes rule-breaking feel rational in the moment.
    Mistake 1
    Overtrading to recover losses

    When a strategy starts losing, the instinct is to trade more — more positions, more frequency, more size. This is the opposite of what the data supports. ASIC Report 828 found that among the most active retail traders (50 or more open positions per month), 19% of those who would otherwise have profited ended up losing money after fees. More activity did not produce better outcomes. It produced worse ones. The fee drag alone flipped one in five active traders from profit to loss.

    Mistake 2
    Using a bull-market strategy without adjustment

    A strategy optimised for trending upward conditions will produce a different — usually worse — outcome when applied to a bear market without modification. This is not a flaw in the strategy; it is a flaw in the application. Bear markets change volatility, correlation, and the reliability of momentum signals. If your strategy has not been reviewed and adjusted for these conditions, you are using the wrong tool for the job. That is a choice, not bad luck.

    Mistake 3
    Abandoning the strategy mid-drawdown

    Every strategy has drawdown periods. A drawdown during a bear market feels different — it feels like the strategy is broken, the market is broken, everything is broken. That feeling is not reliable information. The correct response to a drawdown is to review whether the rules are being followed correctly, not to abandon the rules entirely. Abandoning a strategy mid-drawdown and switching to something else is how traders compound losses rather than recover from them.

    The evidence: ASIC Report 828 also found that 5% of retail clients would have made a net profit but ended up in a loss position purely because of fees. That is one in twenty traders who did the hard work of being profitable — and still lost money because of costs they did not account for. Fees are not a footnote. They are a material part of your strategy’s performance calculation.
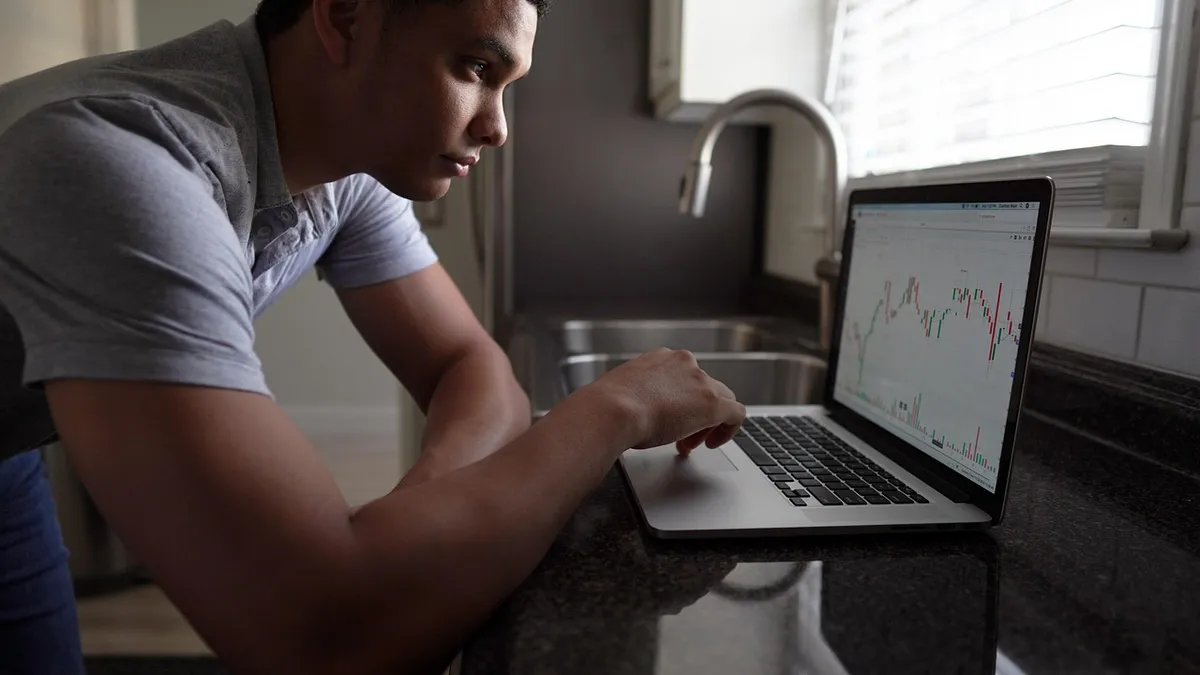
    common trading strategy mistakes in bear market conditions — Crazii JTVertex
    Behavioural mistakes — not technical ones — are the primary cause of strategy failure during market downturns. · Photo: TheInvestorPost / Pixabay
    Avoiding mistakes is necessary. But it is not sufficient. A strategy that avoids errors but has never been tested is still untested. That brings us to the most underused step in strategy development.

    Ready to take your strategy further?

    Join the Crazii JTVertex community for ongoing signal analysis, strategy discussion, and support from traders who understand the Australian market.

    Join the community

    How do you test and refine your trading strategy before going live in volatile conditions?

    How do you test and refine your trading strategy before going live in volatile conditions?
    💡

    Key points: Testing a trading strategy before live deployment involves backtesting against historical bear-market periods, then forward-testing in a demo environment under current conditions. Neither step alone is sufficient — backtesting shows historical fit, forward-testing reveals how the strategy behaves in real time without real money at risk.

    This is where most traders cut corners. Backtesting feels tedious. Demo trading feels pointless when you are eager to trade real money. Both feelings are understandable. Both are expensive if you act on them. Backtesting means applying your strategy rules to historical price data to see how they would have performed. The important word is “rules” — not “judgement.” If you are manually reviewing historical charts and thinking “I would have entered here,” that is not backtesting. That is hindsight. True backtesting applies your rules mechanically, without adjusting for what you know happened next. For Australian traders, the periods worth backtesting specifically include the COVID crash of February–March 2020 and the rate-hike-driven selloff of 2022. These are recent, local-context bear periods with real data. If your strategy survived those periods without exceeding your maximum drawdown parameter, that is meaningful information. If it did not, that is also meaningful information — and better to know now. Forward-testing in a demo account is the next step. This is where you run your strategy in real time, with real signals, under real market conditions — but with simulated money. The value is not just in the performance numbers. It is in what you learn about yourself. Do you actually follow your rules when a position moves against you? Do you honour your daily loss cap? Do you exit when your exit rule triggers, or do you wait “just a little longer”?

    The evidence: The ASIC data on retail CFD outcomes (Report 828, January 2026) shows that 74% of new retail clients acquired through paid online advertising lost money in FY2023–24. That is higher than the overall 68% loss rate. One interpretation: traders who enter the market through advertising-driven channels may be less prepared — less tested, less structured — than those who have done the groundwork first. Preparation is not a guarantee. But the absence of it is consistently correlated with worse outcomes.

    Marcus went back to his strategy after that Tuesday in 2022. He backtested it against the 2022 rate-hike period. He found that his entry signals were generating trades at a rate three times higher than in calmer conditions — which meant his fees were tripling at exactly the moment his win rate was declining. He adjusted his entry filter to require two confirmations instead of one. His trade frequency dropped. His results improved. That adjustment took him one afternoon. The cost of not making it had been months of losses.

    Expert tip: Crazii JTVertex uses a specific rule when reviewing backtest results: if the strategy’s worst drawdown period does not coincide with a known market event (a crash, a rate decision, a geopolitical shock), be suspicious. Drawdowns that happen “for no reason” usually mean the strategy is picking up noise rather than signal. The best strategies have explainable losses — you can point to the market condition that caused them. Unexplainable losses suggest the edge is weaker than the backtest implies.

    1

    Select your bear-market backtest periods

    Choose at least two distinct bear or high-volatility periods relevant to your market. Apply your strategy rules mechanically. Record every entry, exit, and the outcome. Do not adjust rules mid-backtest.

    2

    Run a minimum 30-trade forward test in demo

    Thirty trades is a personal heuristic — below that, the sample is too small to draw conclusions. Track not just profit and loss, but rule adherence. Did you follow every rule on every trade? If not, why not? The answer to that question is more valuable than the P&L.

    3

    Review and adjust before going live

    After forward-testing, review the results with the same critical eye you would apply to someone else’s strategy. Identify the two or three trades where you deviated from your rules. Understand why. Then decide whether the rule needs changing or your discipline does. Usually, it is the latter.
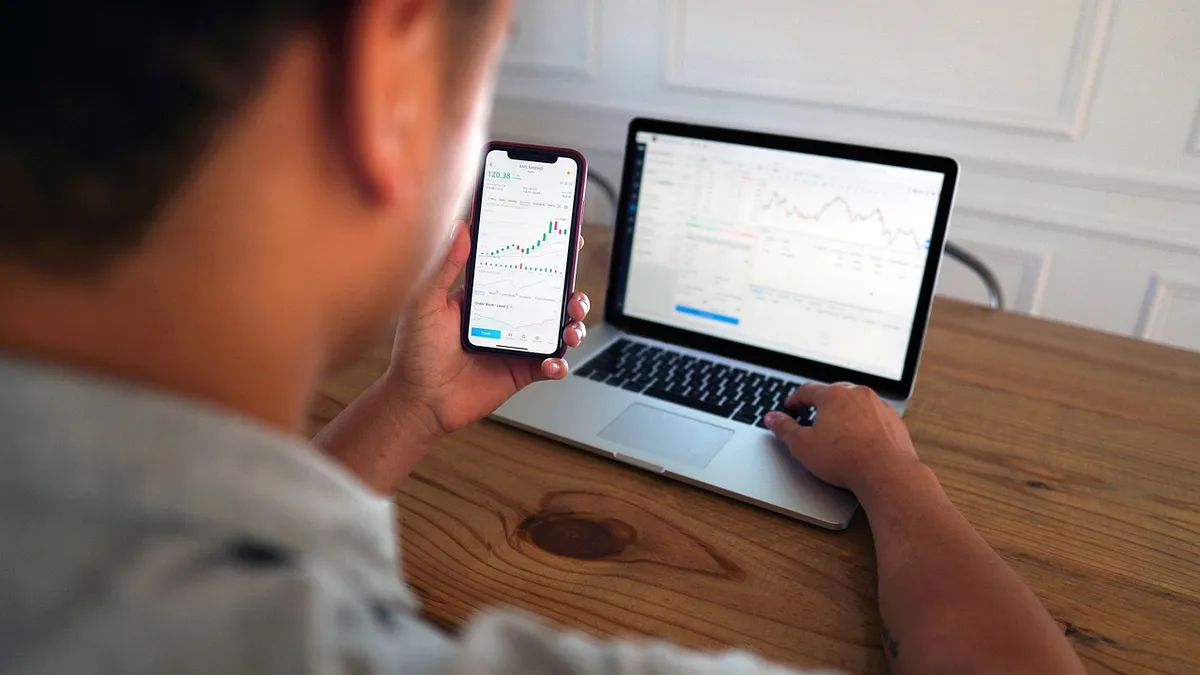
    backtesting and refining a trading strategy for volatile markets — Crazii JTVertex
    Backtesting against historical bear-market periods reveals how a strategy performs before real money is at risk. · Photo: TheInvestorPost / Pixabay

    Frequently asked questions about building a trading strategy
    Frequently asked questions about building a trading strategy

    How long does it take to build a trading strategy that works in a bear market?

    There is no fixed timeline, but a realistic expectation is several weeks of research, backtesting, and demo trading before going live. Rushing this process to start trading sooner is one of the most common and costly mistakes Australian retail traders make.

    Can a beginner build a bear-market trading strategy without prior experience?

    Yes, but with realistic expectations. A beginner’s first strategy will be imperfect — the goal is to make it rules-based and testable, not perfect. Start with a single instrument, a simple signal set, and conservative risk parameters. Complexity can come later.

    Do trading signals work differently in a bear market compared to a bull market?

    Yes. Momentum signals and trend-following indicators tend to produce more false entries in choppy, declining markets. Signals need to be paired with volatility filters and confirmation tools to reduce noise. A signal that performed well in 2021 may need adjustment for 2022-style conditions.

    How much of my account should I risk per trade in a bear market?

    This is a personal decision based on your circumstances, but a commonly used heuristic is keeping per-trade risk below 1–2% of total account equity. In a bear market, erring toward the lower end of that range is prudent because volatility amplifies both gains and losses. This is not financial advice — consider your own situation.

    Is copy trading a valid strategy during a bear market?

    Copy trading can be part of a strategy, but it does not remove risk — it transfers decision-making to another trader. In a bear market, it is important to understand whether the trader you are copying uses a long-biased strategy, because that strategy will typically perform worst during sustained market declines. Always read the relevant disclosure documents.

    Want to talk through your trading strategy?

    Crazii JTVertex is available for direct questions — reach out through the contact page or join the community group for ongoing support.

    Get in touch

    Note: This article contains general information only and is not personal financial advice. CFD trading and margin FX are high-risk activities. According to ASIC Report 828 (January 2026), 68% of retail CFD clients in Australia lost money in FY2023–24. Past performance is not indicative of future results. Always read the Product Disclosure Statement and consider your own financial circumstances before trading. For personalised advice, speak with a licensed financial adviser.

  • Gold Trading Signals Strategy That Survived 3 Rate Hike Cycles

    Gold Trading Signals Strategy That Survived 3 Rate Hike Cycles

    A gold trading signals strategy that actually holds up across rate hike cycles is rarer than most traders realise — and the difference between one that survives and one that collapses under pressure often comes down to three overlooked decisions made before a single trade is placed. Drawing on years of live-market experience through multiple RBA and Fed tightening phases, Crazii JTVertex has stress-tested signal frameworks so you don’t have to learn these lessons the expensive way. In this guide on the gold trading signals strategy that survived 3 rate hike cycles, you’ll walk away with a repeatable framework — including a practical checklist — that you can apply to your next XAUUSD trade before the week is out.

    Note: This content is general information only and does not constitute personal financial advice. Trading CFDs and margin FX products carries significant risk — ASIC data shows 68% of Australian retail CFD clients lost money in FY2023–24. Consider your own circumstances and read all relevant disclosure documents before trading.

    🛠️ Tools That Work Alongside This Strategy

    Signals Platform

    Crazii Signal Access

    Tired of chasing signals that vanish the moment volatility spikes? Get structured gold signals built for Australian market hours.

    Access Crazii Signals
    Trading Platform

    AIMS Trading Account

    A signal without a reliable execution environment is just a suggestion. Open your account and put the strategy to work.

    Open AIMS Account

    Ready to Trade Gold With a Strategy That’s Been Through the Fire

    Join traders who are using structured signal frameworks — not guesswork — to navigate XAUUSD through high-volatility environments.

    Start With Crazii
    Table of contents

    Why Does a Gold Trading Signals Strategy Break Down During Rate Hikes?

    Why Does a Gold Trading Signals Strategy Break Down During Rate Hikes?
    💡

    Key points: Most gold trading signal strategies fail during rate hike cycles because they were calibrated on low-volatility, low-rate data. When central banks tighten, XAUUSD correlation patterns shift — and signals built for trending conditions start generating false entries in choppy, mean-reverting price action.

    Here’s the uncomfortable truth most signal providers won’t tell you. The majority of gold trading signals you’ll find online were backtested in the 2012–2021 era — a decade defined by near-zero interest rates, predictable Fed language, and gold behaving like a simple inverse-USD trade. That environment is gone. And the strategies that thrived in it have been quietly bleeding accounts since 2022. When a rate hike cycle begins, three things happen to XAUUSD simultaneously. First, the US dollar strengthens, which mechanically pressures gold prices. Second, real yields rise — and gold, which pays no yield, becomes comparatively less attractive to institutional allocators. Third, and this is the part nobody talks about: volatility character changes. Gold stops trending cleanly and starts whipsawing inside a 20–40 dollar range for days at a time, triggering stop-losses on signals that would have worked perfectly in the previous regime. Think of it like this: a signal system calibrated on 2019 data is like a weather forecast model trained only on summer. It will confidently predict sunshine — right up until the first storm hits.

    The evidence: ASIC’s Report 828 (January 2026) found that 68% of Australian retail CFD clients lost money in FY2023–24, with net losses exceeding $458 million. This covers the period when the RBA was actively hiking rates. Among active traders placing 50 or more open positions per month, 19% of those who would otherwise have been profitable were pushed into a net loss purely by fees — meaning more trading during volatile rate-hike conditions made outcomes materially worse, not better. Source: ASIC, Report 828, 20 January 2026.

    Consider Jamie, a 34-year-old project manager from Brisbane who started trading XAUUSD in late 2021. He had a signal service that looked brilliant on paper — consistent entries, clean risk ratios. Then 2022 arrived. The RBA began hiking. His signals kept firing long entries during what turned out to be sustained USD strength phases. He wasn’t doing anything wrong in execution. The strategy itself had simply never encountered this environment. That’s the real problem. Not the trader. The framework.

    Expert tip: Crazii JTVertex learned this directly: during the first month of the 2022 Fed hiking cycle, every signal generated by a momentum-based system misfired on XAUUSD because momentum thresholds calibrated on 2020–2021 data were set too sensitive. The fix wasn’t to stop trading — it was to widen the confirmation window from 4-hour closes to daily closes before acting. That one adjustment alone changed the character of entries completely.

    The mechanism is straightforward once you see it. Rate hike cycles compress the “signal-to-noise ratio” in gold price action. Entries that would have run 80–100 pips in a low-rate trend environment now reverse after 25–30 pips, hitting stops before the move resumes. The signal isn’t wrong about direction. It’s wrong about timing and magnitude. This is why a rate-cycle-tested gold signals strategy doesn’t just look at entry conditions. It looks at regime conditions first. For a broader look at how signal tools fit into a complete trading approach for Australian traders, the guide on best trading signals and tools for Australian traders 2026 covers the full landscape worth understanding before committing to any single framework.
    gold trading signals strategy breaking down during rate hike cycles XAUUSD Crazii JTVertex
    How XAUUSD signal reliability shifts when rate hike cycles change market regime — Crazii JTVertex analysis · Photo: sergeitokmakov / Pixabay

    What Does a Rate-Cycle-Tested Gold Signal Framework Actually Look Like?

    What Does a Rate-Cycle-Tested Gold Signal Framework Actually Look Like?
    💡

    Key points: A rate-cycle-tested XAUUSD signal framework operates on three layers: a macro regime filter that identifies whether gold is in a risk-on, risk-off, or rate-driven environment; a technical entry layer using confirmed structure; and a position-sizing rule that adjusts for elevated volatility conditions rather than applying fixed lot sizes.

    So what does a framework that actually survived three tightening cycles look like in practice? It starts with a question most retail traders never ask: what is gold doing right now, and why? Not the entry signal. The regime. The first layer is the macro regime filter. Before any signal is considered, the framework checks three conditions: the direction of real US Treasury yields (specifically the 10-year TIPS yield), the DXY trend on the weekly chart, and whether the current rate hike cycle is in an early, mid, or late phase. Early hike phases tend to be the most brutal for gold longs. Late phases — where markets begin pricing in a pivot — are often where gold’s strongest recoveries begin. Knowing which phase you’re in changes everything about how aggressively you act on a signal. The second layer is technical entry confirmation. This is where RSI (with standard thresholds of 30 for oversold and 70 for overbought) meets structure. Specifically, the framework uses daily candlestick closes above or below a key structural level as confirmation — not intrabar touches. An RSI reading of 28 on a 4-hour chart means nothing if the daily candle hasn’t confirmed the reversal. This single rule eliminates the majority of false entries during choppy rate-hike conditions.

    The evidence: ASIC Report 828 notes that 26,243 Australian retail clients used copy trading in FY2023–24, with MetaTrader hosting over 3,200 signals on its marketplace. Yet the same report shows that the majority of retail clients still lost money — confirming that access to signals alone, without a structured framework for applying them, does not improve outcomes. Source: ASIC, Report 828, 20 January 2026; MetaQuotes, MetaTrader 5 Signals, accessed 16 June 2026.

    The third layer — and the one most traders skip entirely — is dynamic position sizing. During rate hike cycles, XAUUSD average daily ranges can expand significantly compared to low-volatility periods. Applying the same lot size you used in 2020 to a 2023 market is how accounts get damaged in a single session. The framework adjusts position size based on the current average true range relative to a 90-day baseline. When ATR is elevated, size goes down. The result per trade in dollar terms stays roughly consistent even as market conditions shift.

    Expert tip: We discovered this the hard way: in mid-2022, we was running standard 0.10 lot sizes on XAUUSD signals that had worked fine for months. When the Fed accelerated hikes in June 2022, the daily range on gold nearly doubled overnight. The same signal, same lot size, same stop-loss distance — but the stop was now being hit before the trade had any room to breathe. Cutting position size by roughly a third during high-ATR periods was the adjustment that kept the framework functional through that stretch.

    Jamie — the Brisbane trader from earlier — eventually rebuilt his approach using exactly this three-layer structure. He stopped acting on every signal and started filtering first by regime, then by daily structure confirmation, then by adjusting size to match current volatility. The change wasn’t dramatic on any single trade. Over a quarter, though, the difference in drawdown was substantial. For traders wanting to understand the foundational mechanics before applying any signal framework, gold trading signals explained for traders watching XAUUSD daily provides the conceptual grounding this framework builds on.
    rate-cycle-tested XAUUSD signal framework three layers macro technical position sizing Crazii JTVertex
    Three-layer gold signal framework structure used by Crazii JTVertex across multiple rate hike environments · Photo: TheInvestorPost / Pixabay

    Get the Signal Framework Working For You — Not Against You

    Crazii JTVertex provides structured gold signals designed around regime awareness, not just technical entries. Join the community and see how the framework applies in live conditions.

    Join the Group

    How Do You Filter Gold Signals to Avoid the Traps Most Traders Fall Into?

    How Do You Filter Gold Signals to Avoid the Traps Most Traders Fall Into?
    💡

    Key points: Filtering gold trading signals effectively means applying a minimum track record threshold, checking signal performance specifically during high-volatility periods rather than overall averages, and avoiding signals from providers who show fewer than 100 completed trades in their history — as small sample sizes hide true drawdown characteristics.

    You’ve found a gold signal provider. The stats look solid. But here’s the question that actually matters: did those results include any rate hike months? This is the filter most traders never apply. They look at overall win rate, overall profit factor, overall drawdown. What they don’t check is whether the signal performed during the specific market conditions that are most likely to occur again. The practical filtering checklist works like this. First, any signal provider with fewer than 100 completed trades should be treated as unproven — this is a personal heuristic, not a statistical rule, but it reflects the reality that small sample sizes can make genuinely poor systems look excellent by chance. Second, look at the monthly breakdown. Find the months that coincided with known rate decisions — RBA announcement months, FOMC meetings, CPI release weeks — and see what happened to the signal’s performance during those specific periods. A signal that shows consistent returns in calm months but catastrophic drawdowns around macro events is not a rate-cycle strategy. It’s a fair-weather one. Third: fees. This point deserves its own paragraph. ASIC’s Report 828 found that 5% of Australian retail CFD clients would have made a net profit but ended up in a loss solely because of fees. That’s one in twenty traders who were actually right about the market but still lost money. Among active traders with 50 or more open positions per month, 19% of those who would otherwise have been profitable were pushed into a loss by fees alone. Tighter spreads and lower commission structures are not a minor consideration — they are a structural edge.

    The evidence: Of the $458 million in net losses recorded by Australian retail CFD clients in FY2023–24, $73 million was attributable to fees. That’s roughly one dollar in every six lost being a fee rather than a market loss. Source: ASIC, Report 828, 20 January 2026.

    In practical terms: $73 million in fees across 133,674 losing clients averages to roughly $546 per losing client per year going purely to fees before any market losses are counted. That’s money leaving accounts before a single trade goes wrong.

    Expert tip: Crazii JTVertex applies one filter that almost nobody else mentions: we look at whether a signal provider’s drawdown periods align with known macro events or appear random. Random drawdowns suggest system noise. Drawdowns that cluster around rate decisions suggest the system has a specific vulnerability — one that can potentially be managed by simply not trading during those windows. That’s a workable flaw. Random drawdowns are not.

    There’s also the question of signal frequency. More signals do not mean more opportunity. ASIC’s data shows that more active traders — those with 50 or more open positions per month — faced worse net outcomes than less active ones when fees were factored in. The framework Crazii JTVertex uses deliberately reduces signal frequency during high-ATR, high-uncertainty periods. Fewer trades. Cleaner entries. Better outcomes per trade placed. For traders wanting to understand XAUUSD mechanics before applying any signal filter, what is XAUUSD trading and why Forex traders love gold covers the foundational context that makes these filters make sense.
    filtering XAUUSD gold signals by track record and macro event performance Crazii JTVertex
    Practical signal filtering approach for XAUUSD — checking performance during rate decision periods, not just overall averages · Photo: TheInvestorPost / Pixabay

    See How Structured Gold Signals Perform in Real Conditions

    The Crazii signal framework applies these exact filters before any trade is shared. No guesswork. No fair-weather stats.

    View Crazii Signals

    Which Common Mistakes Destroy a Gold Trading Signals Strategy Under Pressure?

    Which Common Mistakes Destroy a Gold Trading Signals Strategy Under Pressure?
    💡

    Key points: The three most destructive mistakes in a gold signals strategy during rate hike cycles are: treating every signal as equal regardless of market regime, using fixed position sizes when volatility has expanded, and overtrading to recover losses — which compounds fee drag and worsens net outcomes according to ASIC data.

    At 11pm on a Tuesday, Jamie was staring at a XAUUSD chart that had just moved 90 pips against him in 40 minutes. His signal said buy. He bought. The position was now deep in the red. And the thought running through his head wasn’t “what went wrong with the signal” — it was “how do I get this back.” That’s the moment most strategies collapse. Not the bad entry. What comes after it.
    Mistake 1
    Treating every signal as equal regardless of regime

    A buy signal on XAUUSD during an early rate hike phase carries fundamentally different risk characteristics than the same signal in a late-cycle pivot environment. Applying the same position size and confidence level to both is how a single bad month wipes out a good quarter. The framework assigns a regime score before any signal is acted on — and during early hike phases, signal confidence is reduced by default.

    Mistake 2
    Using fixed lot sizes when market volatility has expanded

    This is the most common technical error we sees among traders who have otherwise solid signal frameworks. When XAUUSD’s average daily range expands during a rate shock, a fixed stop-loss distance that worked in calm conditions now gets hit before the trade has any room to develop. The fix is straightforward: scale position size inversely with ATR expansion. If volatility doubles relative to the 90-day baseline, halve the position size. The dollar risk per trade stays consistent. The account survives.

    Mistake 3
    Overtrading to recover losses — the fee compounding trap

    ASIC data is unambiguous here: among retail clients who traded most actively (50+ open positions per month), 19% of those who would otherwise have been profitable were pushed into a loss by fees. More trades during a losing streak doesn’t recover losses — it accelerates them through fee drag. The correct response to a losing signal run during a rate hike period is to reduce frequency, not increase it. We has a personal rule: after three consecutive signal losses in a week, no new trades until the next session’s regime check is complete.

    Here’s the thing about these three mistakes: they’re not about intelligence. Jamie is sharp. He understood the technical setup. What he didn’t have was a written rule that told him what to do when the market stopped cooperating. A framework without explicit rules for adverse conditions is just a strategy for when things go well. The loss aversion reality is this: every week you trade without a regime filter and dynamic sizing rule, you’re not just risking a bad trade. You’re risking the kind of drawdown that makes you question the whole approach — and potentially exit at exactly the wrong time. But there’s a clear path forward. And it starts with the next section.
    common mistakes gold signal strategy overtrading fee drag rate hike environment Crazii JTVertex
    Three critical errors that compound losses in XAUUSD signal trading during tightening cycles — Crazii JTVertex framework · Photo: TheInvestorPost / Pixabay

    Is This Gold Signal Strategy Right for You — or Should You Wait?

    Is This Gold Signal Strategy Right for You — or Should You Wait?
    💡

    Key points: This gold trading signals strategy suits Australian traders who already understand basic XAUUSD mechanics, have a live or demo account ready, and can commit to checking macro regime conditions before acting on entries. It is not suited to traders who want fully automated, zero-input signal following — regime filtering requires a human decision at each step.

    Let’s be direct about who this is and isn’t for. Because a strategy that’s right for the wrong person does more damage than no strategy at all. This framework suits you if you’re an Australian trader who has already spent time understanding how XAUUSD moves — not just technically, but in relation to macro events. If you’ve read through resources like how to trade XAUUSD without blowing your account early and you understand concepts like real yields, DXY correlation, and the difference between a trending and mean-reverting market, you’re in the right place. It also suits you if you’re willing to treat signals as inputs to a decision, not as automatic orders. The regime filter requires a 10-minute check before each trade session. That’s not a burden — it’s the difference between a strategy and a slot machine. Who should wait? Traders who are brand new to CFDs and haven’t yet traded XAUUSD on a demo account. Traders who are looking for a fully passive, copy-trade-and-forget solution. And traders who are in a financial position where any loss would cause genuine hardship — because CFD trading is high-risk, and even a well-structured framework will have losing periods. Imagine waking up on a Thursday morning, having done your 10-minute regime check the night before. You see a signal has fired on XAUUSD that aligns with both the macro filter (late-cycle, real yields plateauing) and the daily structure confirmation. You place the trade at a position size calibrated to current ATR. Then you go to work. The trade runs. By the time you check at lunch, it’s closed at target. That’s not fantasy — that’s what the framework is designed to produce, consistently, over time.

    Expert tip: Crazii JTVertex’s personal benchmark for evaluating whether a gold signal framework is worth continuing: track the ratio of signals acted on versus signals generated. If you’re acting on more than 60% of signals during a rate hike month, you’re probably not filtering enough. The framework deliberately generates fewer tradeable setups during uncertain macro conditions — and that restraint is a feature, not a bug.

    You’re probably thinking: this sounds like a lot of work compared to just following a signal channel. That’s a fair thought. Here’s the honest answer: the work is the edge. The 68% of retail clients who lost money in FY2023–24 weren’t all bad traders. Many of them were following signals. The difference was the absence of a framework around those signals. The comparison to the old approach is straightforward. Following signals without a regime filter or dynamic sizing means your results are entirely dependent on whether the market happens to be in the conditions the signal was designed for. With the framework, you’re making an active decision about when the signal is likely to be reliable. That’s not a small distinction.
    Approach Regime Awareness Position Sizing Fee Management Suited To
    Raw signal following (no framework) None Fixed Not considered Bull markets only
    Copy trading (MT5 marketplace) Depends on provider Provider-set Compounded by fees Passive traders
    Rate-cycle-tested framework (this article) 3-layer filter Dynamic (ATR-adjusted) Reduced frequency = lower drag Active, informed traders
    gold signal strategy suitability comparison Australian traders XAUUSD rate hike framework Crazii JTVertex
    Comparing gold signal approaches for Australian retail traders — framework vs raw signal following in rate hike conditions · Photo: TheInvestorPost / Pixabay

    Frequently Asked Questions About Gold Trading Signals Strategy

    Frequently Asked Questions About Gold Trading Signals Strategy

    Can a gold trading signals strategy work during active rate hike cycles?

    Yes, but only with a regime filter applied first. Signals calibrated on low-rate data will underperform during tightening cycles without adjustment. The three-layer framework — macro filter, structural confirmation, dynamic sizing — is specifically designed for this environment.

    How many gold signals should I act on per week during a rate hike period?

    This is a personal heuristic rather than a fixed rule: fewer than you think. During high-ATR, macro-uncertain periods, the framework deliberately reduces signal frequency. Quality of entry matters far more than volume of trades — and ASIC data confirms that higher trading frequency correlates with worse net outcomes after fees.

    What is the minimum track record I should look for in a gold signal provider?

    As a personal benchmark, we would not act on signals from a provider with fewer than 100 completed trades in their history. Small sample sizes can make poor systems look excellent by chance. More importantly, check whether any of those trades occurred during rate decision months.

    Do fees really make that much difference to gold signal trading outcomes?

    ASIC’s data is clear: $73 million of the $458 million in net losses by Australian retail CFD clients in FY2023–24 was attributable to fees. Five per cent of clients would have been profitable but were pushed into a loss by fees alone. Fee structure is a structural edge, not a minor consideration.

    Is this gold signal framework suitable for copy trading on MetaTrader?

    The framework’s regime filter and dynamic sizing components require active human decisions at each step — they can’t be fully automated through a copy-trade setup. The signal layer can be delivered via a community or channel, but the filtering and sizing decisions remain with the trader. That’s by design.

    Talk to Crazii JTVertex Directly

    If you want to understand how this framework applies to your specific situation as an Australian trader, reach out. This is general information — your circumstances are specific, and the conversation should be too.

    Contact Us

    Note: Trading CFDs, margin FX, and gold instruments carries significant risk of loss. This article is general information only and does not constitute personal financial advice. Past signal performance does not guarantee future results. Consider your own financial circumstances and read all relevant Product Disclosure Statements and Target Market Determinations before trading. ASIC data: 68% of Australian retail CFD clients lost money in FY2023–24.