Tag: best trading signals on tradingview

  • Best Trading Signals TradingView Indicators Ranked This Year

    Best Trading Signals TradingView Indicators Ranked This Year

    The best trading signals TradingView has to offer are not the flashiest ones — they are the ones that hold up when the market stops behaving. As someone who has spent years testing indicators across live accounts, Crazii JTVertex knows that most Australian traders waste months on tools that look brilliant in a backtest and fall apart in real conditions. This guide, published at jtvertex.com.au, ranks the indicators that actually matter — and by the time you finish reading, you will know exactly which ones deserve a place on your chart and which ones are quietly costing you money.

    Note: This content is general information only and does not constitute personal financial advice. Trading signals, CFDs, and margin FX are high-risk products. Always consider your own circumstances, read the relevant product disclosure statements, and seek independent financial advice before trading.

    🛠️ Tools Crazii JTVertex Uses Right Now

    Signals Platform

    Crazii — Live Trading Signals

    Tired of staring at charts for hours and still missing entries? Crazii delivers structured signals so you spend less time second-guessing and more time executing with a plan.

    Join Crazii Signals
    Trading Platform

    AIMS — Execution Platform

    A signal without a reliable platform to execute it is just noise. AIMS gives you the infrastructure to act on your signals quickly and cleanly.

    Open AIMS Account
    Table of contents

    Which TradingView indicators actually generate reliable trading signals?
    Which TradingView indicators actually generate reliable trading signals?
    💡

    Key points: The most reliable TradingView trading signals come from combining momentum, trend, and volume indicators rather than relying on a single tool. RSI, MACD, EMA crossovers, and VWAP consistently outperform exotic alternatives when tested across real market conditions over multiple months.

    Most traders start with the wrong question. They ask “which indicator is best?” when the real question is “which combination confirms an edge without contradicting itself?” Here is the honest answer from someone who has run these setups on live accounts. The RSI (Relative Strength Index) remains the backbone of most signal setups on TradingView because it is genuinely readable. When RSI drops below 30, the asset is considered oversold; above 70, overbought — those are the thresholds J. Welles Wilder established, and they still hold as a starting filter. But used alone, RSI generates too many false entries in trending markets. That is not a flaw in the indicator. That is a flaw in how most people deploy it. Pair RSI with a 20-period Exponential Moving Average and the picture sharpens. The EMA tells you the direction of momentum; RSI tells you whether you are buying strength or chasing exhaustion. When price is above the EMA and RSI crosses back above 30 after a dip, that is a structurally sound long signal. Not perfect. But structurally sound. MACD (Moving Average Convergence Divergence) adds a third layer. A histogram crossing from negative to positive while price holds above the EMA and RSI recovers from oversold territory — that confluence is the kind of signal worth acting on. The three indicators are not redundant. They are measuring different things: trend direction, momentum speed, and momentum relative to price range. VWAP (Volume Weighted Average Price) is underused by retail traders in Australia. Institutions use it constantly. Price reclaiming VWAP after a pullback, especially during the first two hours of a session, is one of the cleaner intraday signals available on TradingView.

    The evidence: According to ASIC Report 828 (published January 2026), 68% of Australian retail CFD clients lost money in FY2023–24. That figure is not an argument against trading — it is an argument for using structured, rules-based signal setups rather than discretionary gut calls. Traders with a defined entry framework are at least working from a repeatable process that can be refined.

    Expert tip from Crazii JTVertex: The one thing nobody tells you about MACD on TradingView is that the default settings (12, 26, 9) are calibrated for daily charts. If you drop to a 15-minute chart without adjusting, the histogram fires so frequently it becomes noise. We personally use (8, 21, 5) on intraday setups — not because it is textbook, but because it reduces lag enough to catch the early part of a move rather than confirming it after it has already run. That is a setting we arrived at after watching entries miss by two candles too many times.

    1

    Set your trend filter first

    Add a 50 EMA to your chart. Only take long signals above it and short signals below it. This one rule eliminates a large proportion of counter-trend false entries before you even look at RSI or MACD.

    2

    Add RSI as your momentum gate

    Set RSI to 14 periods. Use the standard 30/70 thresholds. Only act on signals that align with the EMA direction and show RSI recovering from an extreme — not RSI already at 65 and climbing.

    3

    Use MACD for timing confirmation

    Wait for the MACD histogram to confirm the direction before entering. This delays your entry slightly but dramatically reduces the number of trades you take against momentum.
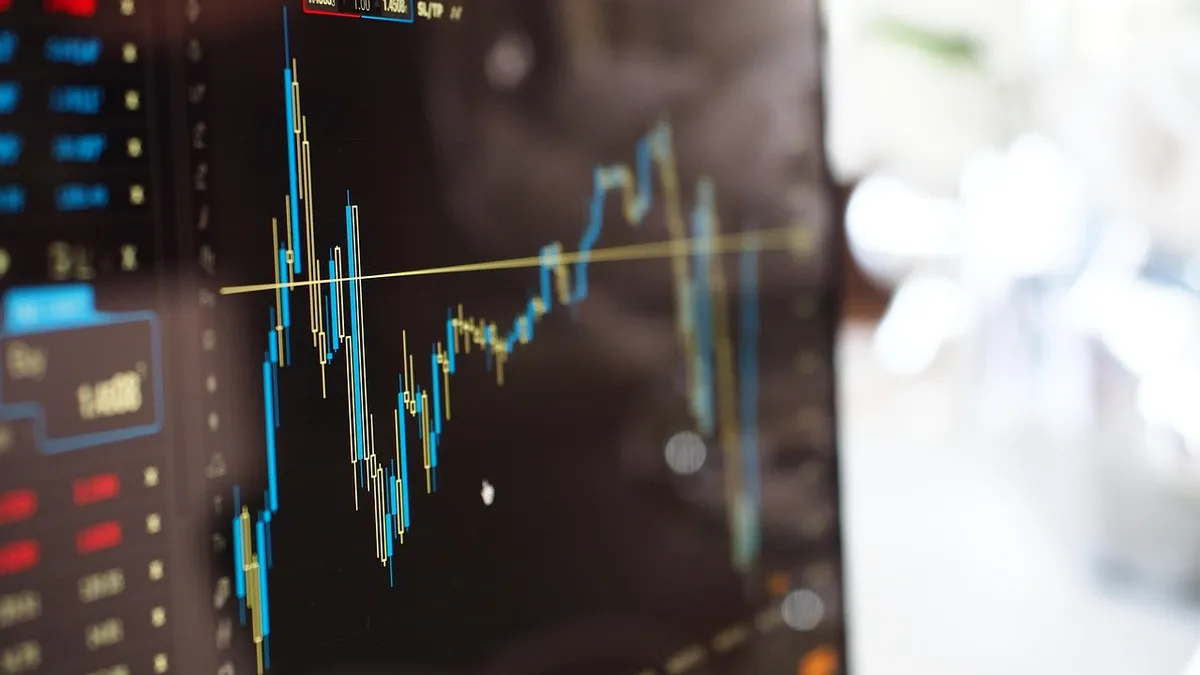
    best trading signals TradingView indicators RSI MACD EMA setup Crazii JTVertex
    A three-indicator confluence setup for generating reliable TradingView trading signals — trend, momentum, and confirmation working together. · Photo: Pexels / Pixabay
    That is the foundation. Everything else — Bollinger Bands, Ichimoku, Supertrend — layers on top of this core. Do not add complexity until you have mastered the base. And if you want to see how this stacks up against dedicated signal platforms, the best trading signals and tools for Australian traders in 2026 covers the full landscape.

    How do you read TradingView trading signals without misreading the market?

    How do you read TradingView trading signals without misreading the market?
    💡

    Key points: Misreading TradingView signals usually comes down to timeframe mismatch, ignoring market context, and acting on a single indicator in isolation. Reading signals correctly means understanding what the indicator is measuring, not just what it is showing.

    Meet Marcus. He is a 34-year-old project manager from Brisbane who started trading FX pairs in 2023. He had TradingView open every morning before work, a handful of indicators set up, and a genuine willingness to learn. Six months in, he was still losing on more trades than he was winning — not by a catastrophic margin, but enough to feel like the signals were lying to him. They were not lying. He was misreading them. The most common misread is treating a signal as a trade instruction rather than a probability filter. When RSI crosses below 30, that does not mean “buy now.” It means the asset has reached a level where buying pressure has historically been more likely to emerge than selling pressure. That is a conditional statement, not a command. Context is everything. RSI at 28 on a stock in a confirmed downtrend with no catalyst is very different from RSI at 28 on a currency pair that has just bounced off a key support level with volume expanding. The number is the same. The signal quality is not. Timeframe alignment is where Marcus went wrong. He was taking 15-minute signals against a daily trend that was clearly bearish. The short-term indicator said “oversold and bouncing” while the bigger picture said “still falling.” He was fighting the tide with a teacup.

    The evidence: ASIC Report 828 (January 2026) found that among active traders executing 50 or more open positions per month, 19% of otherwise-profitable clients lost money after fees. More trading, triggered by more signals, did not produce better outcomes. Selectivity — taking fewer, higher-quality signals — is a structural edge that most retail traders undervalue.

    The fix is a top-down approach. Start on the daily chart. Identify the trend. Drop to the four-hour chart. Confirm the trend and look for a setup forming. Then drop to the 15-minute chart for entry timing. If all three timeframes agree, the signal is worth acting on. If they conflict, the signal is noise.

    Expert tip from Crazii JTVertex: Here is something we learned the hard way: when a signal fires right before a major economic release — US CPI, RBA rate decision, NFP — the technical picture is almost irrelevant. The market is about to be repriced by news, not by chart patterns. We now have a personal rule: no new entries in the 30 minutes before a tier-one release. That single rule has saved more capital than any indicator tweak.
    Marcus eventually figured this out. He stopped taking every RSI dip as an entry and started asking “what does the daily chart say first?” His win rate improved — not because the indicators changed, but because he changed how he read them. He appears again later in this article, and the difference in his account is worth seeing. If you are exploring whether structured signal services handle this context-reading for you, the review at Is Top Trading Signals Legit or Just Another Overhyped Service is worth your time.
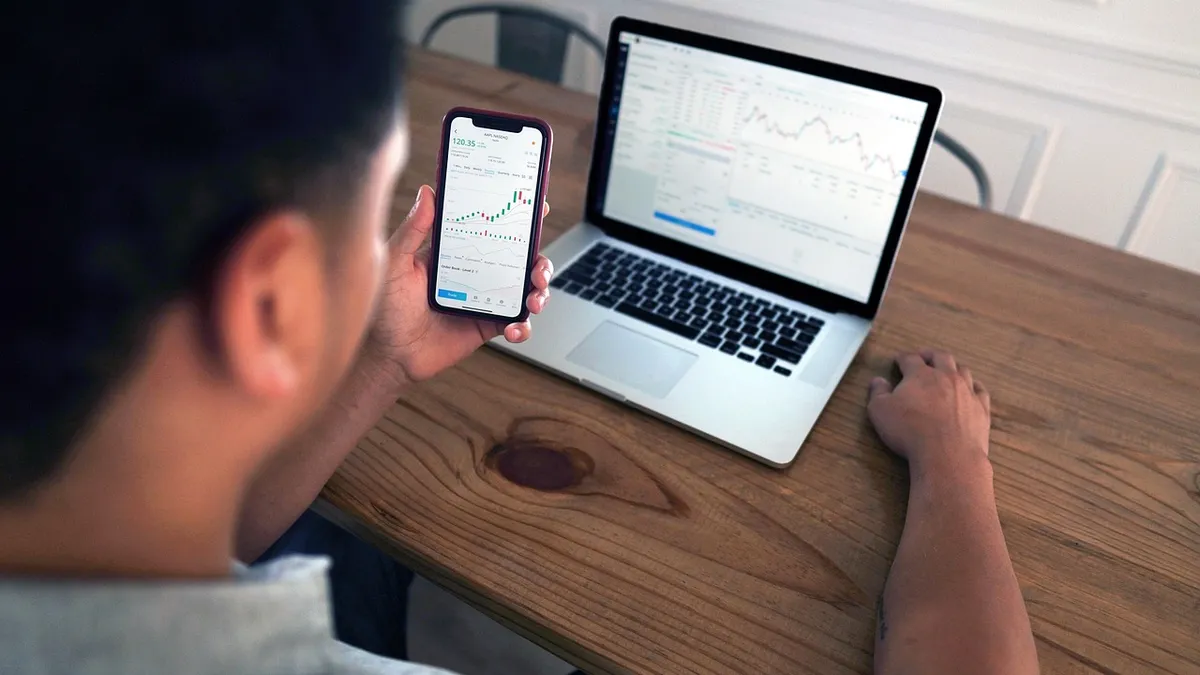
    reading TradingView trading signals timeframe alignment top-down analysis Crazii JTVertex
    Top-down timeframe alignment — how to read TradingView signals in the context of the broader market trend. · Photo: TheInvestorPost / Pixabay

    Want signals that already have context built in?

    Crazii JTVertex publishes structured entries with trend context, not just raw indicator readings.

    Join Crazii Signals

    What separates a paid TradingView signal tool from a free one?

    What separates a paid TradingView signal tool from a free one?
    💡

    Key points: Paid TradingView signal tools typically offer real-time alerts, multi-timeframe confluence scanning, and backtested logic. Free indicators provide the raw building blocks but require you to do the filtering, timing, and context-reading yourself — which is where most retail traders struggle.

    You are probably thinking: the free indicators on TradingView are the same ones the paid scripts use. And you are not entirely wrong. The underlying maths of RSI, MACD, and EMA are public domain. What paid scripts add is the logic layer — the rules that determine when those indicators align in a meaningful way and then alert you automatically rather than requiring you to watch a screen for hours. That distinction matters more than most traders realise. The gap between a free indicator and a paid signal tool is not about the formula. It is about who does the filtering. With free indicators, you are the filter. You decide when RSI plus MACD plus EMA confluence is strong enough to act on. That requires discipline, experience, and time in front of the screen — often a lot of time. Paid TradingView signal scripts automate that filtering. They scan for the confluence conditions you define (or that the script developer has backtested) and fire an alert when those conditions are met. You do not need to watch every candle. You get a notification and then assess whether the context supports the trade.

    The evidence: MetaQuotes’ MQL5 platform lists over 3,200 free and commercial signals in its marketplace as of June 2026. The sheer volume means quality varies enormously. The value of a paid, well-documented signal tool is not exclusivity — it is curation and accountability. A paid script developer who publishes their backtest results and drawdown history is offering something a free indicator simply cannot: a track record with skin in the game.

    What to look for in a paid TradingView signal script before you spend anything: – Published backtest results covering at least 12 months of data, not cherry-picked periods – Maximum drawdown clearly stated (personally, we treats anything above 20% as a red flag — that is a heuristic, not a rule) – Number of trades in the backtest: we would not trust a strategy with fewer than 100 historical trades, because the sample size is too small to be meaningful – Win rate combined with risk-reward ratio — a 40% win rate with a 1:3 risk-reward can be more profitable than a 65% win rate at 1:1

    Expert tip from Crazii JTVertex: The most underrated feature in any paid TradingView signal tool is the alert customisation. Crazii JTVertex specifically looks for scripts that let you set alerts based on confluence conditions across multiple timeframes simultaneously — not just “RSI crossed 30” but “RSI crossed 30 on the 1H while price is above the 4H EMA.” That specificity is what separates a signal worth acting on from background noise. Most traders never configure this properly because it takes 20 minutes to set up properly. That 20 minutes is worth more than a month of watching screens.
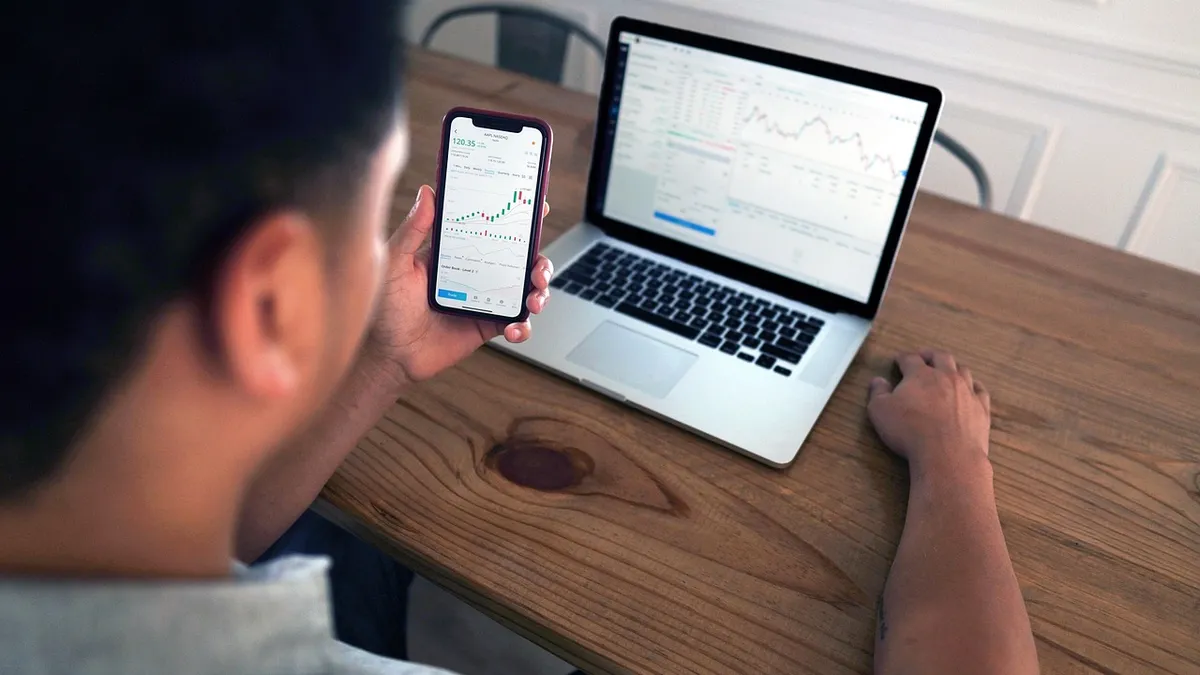
    paid vs free TradingView signal indicator comparison Australian traders Crazii JTVertex
    Comparing paid and free TradingView signal tools — what the price difference actually buys you as an Australian retail trader. · Photo: TheInvestorPost / Pixabay

    Not sure which signal setup suits your trading style?

    Join the Crazii JTVertex community on Telegram — active traders share setups, discuss indicators, and help each other filter signal quality.

    Join the Telegram Group

    What are the most common mistakes traders make with TradingView signal indicators?

    What are the most common mistakes traders make with TradingView signal indicators?
    💡

    Key points: The three most costly mistakes with TradingView signals are over-optimising indicators to past data, ignoring fees in profitability calculations, and treating alerts as automatic trade instructions without assessing market context. Each of these mistakes is avoidable with a clear process.

    Here is the thing nobody wants to say out loud: most traders who lose money with TradingView signals are not losing because the signals are bad. They are losing because of how they use them.
    Mistake 1
    Curve-fitting the backtest

    Adjusting indicator settings until the historical chart looks perfect is not strategy — it is post-rationalisation. A MACD setting that produces a beautiful equity curve on last year’s EUR/USD data will likely fail on this year’s data because the market conditions have changed. We have seen traders spend weeks optimising settings on TradingView’s strategy tester and then watch the same setup lose in live trading. The backtest is a tool for validation, not a guarantee of future performance.

    Mistake 2
    Ignoring the fee drag on signal frequency

    ASIC Report 828 (January 2026) found that 5% of retail clients who would have made a net profit in FY2023–24 ended up in a loss position purely because of fees. That is one in twenty profitable traders tipped into the red by transaction costs. For active traders executing 50 or more positions per month, 19% of otherwise-profitable clients lost money after fees. If your TradingView signal strategy fires 15 entries per week, you need to factor in spread, commission, and overnight funding costs before you can honestly assess whether the strategy is working. Most people do not do this calculation until it is too late.

    Mistake 3
    Acting on alerts without checking context

    An alert fires at 2 am Sydney time on a low-liquidity instrument with a major news event in four hours. Most traders either ignore it (and miss the move) or take it automatically (and get caught in the news spike). Neither approach is right. The alert is a prompt to assess, not a command to act. Building a 30-second pre-trade checklist — trend direction, upcoming news, spread width, session liquidity — before executing any signal is a habit that separates disciplined traders from reactive ones.

    Marcus, the Brisbane project manager from earlier, made all three of these mistakes in his first year. The curve-fitting cost him three months of wasted optimisation time. The fee drag cost him real money on a scalping strategy that looked profitable on paper. The context blindness cost him a particularly painful trade on a Thursday morning when the RBA surprised the market. He now runs a pre-trade checklist. His account has been positive for the last two quarters.

    The evidence: In FY2023–24, 133,674 Australian retail CFD clients lost money, with net losses exceeding $458 million — including $73 million in fees alone, according to ASIC Report 828. To put that in plain terms: if you spread $73 million across those losing clients, fees alone cost each one roughly $547 on average, before a single bad trade is counted. Fees are not a footnote. They are a core part of your trading cost structure.
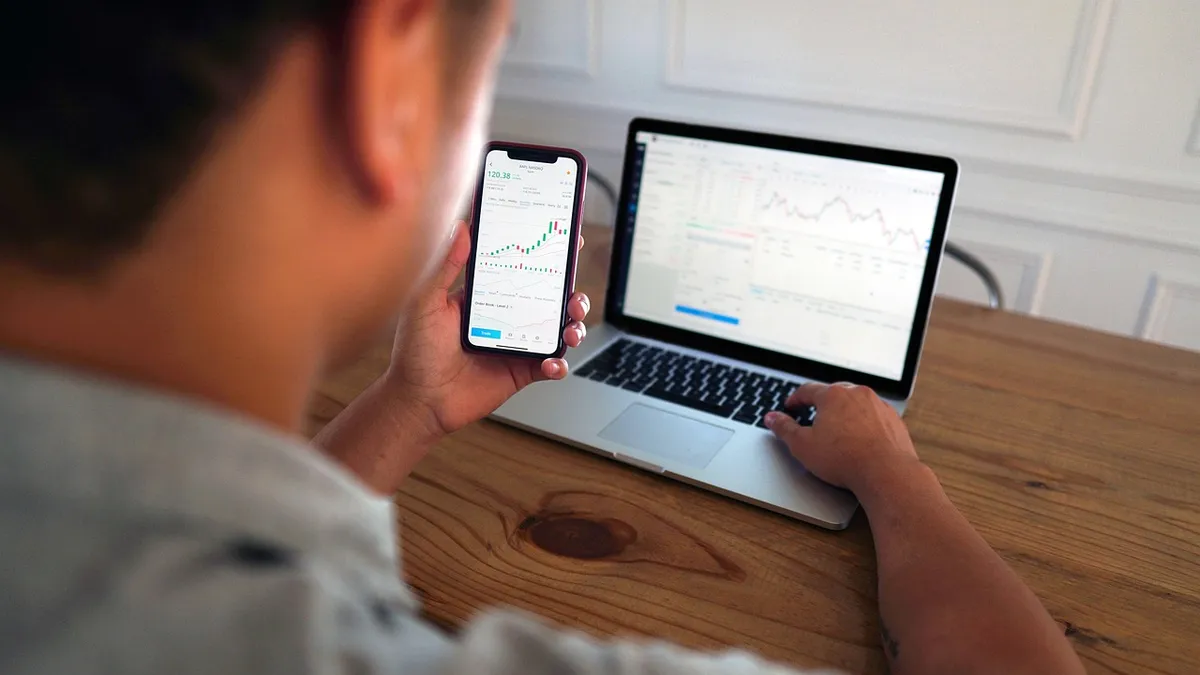
    common mistakes TradingView signal indicators Australian retail traders Crazii JTVertex
    The three mistakes that undermine even well-constructed TradingView signal setups — and how to avoid them. · Photo: TheInvestorPost / Pixabay

    Want a structured approach that accounts for fees and context?

    The AIMS platform pairs with Crazii signals so your execution costs are transparent before you enter any trade.

    Open AIMS Account

    How do TradingView signals compare to other best trading signals platforms available to Australian traders?
    How do TradingView signals compare to other best trading signals platforms available to Australian traders?
    💡

    Key points: TradingView signals are self-managed — you set up the indicators, configure the alerts, and make the call. Dedicated signal platforms handle the analysis and delivery for you. The right choice depends on your available time, experience level, and whether you want to build a skill or access a service.

    This is where most comparison articles go vague. We will be direct. TradingView is a charting platform with signal capability built in. It is extraordinarily powerful for traders who want to build and manage their own signal logic. The Pine Script editor lets you code custom indicators, the alert system is robust, and the community scripts library means you can find almost any indicator someone else has already built. What TradingView does not do is make decisions for you. That is both its strength and its limitation.
    Feature TradingView (Self-Managed) Dedicated Signal Platform (e.g. Crazii)
    Signal generation You configure and interpret Analyst-generated, delivered to you
    Time required High — daily chart monitoring Low — receive and assess alerts
    Skill required Moderate to high Low to moderate
    Customisation Full control via Pine Script Limited to provider’s methodology
    Accountability Entirely yours Shared — provider has a track record
    Best for Experienced traders building systems Traders who want structure without setup
    The honest answer is that TradingView and a dedicated signal platform are not competitors — they are different tools for different stages of a trader’s development. Many experienced traders use both: TradingView for their own analysis and a signal service as a second opinion or as the primary source during busy periods. For Australian traders who are newer to the market, the data from ASIC is sobering: 74% of retail clients acquired through paid online advertising lost money in FY2023–24. That cohort tends to be newer traders who have not yet built a structured approach. A signal platform that provides context, entry levels, and risk parameters is a better starting point than building a TradingView setup from scratch without knowing what you are doing.

    Expert tip from Crazii JTVertex: We use TradingView for chart analysis and Crazii for signal delivery. The combination means we can cross-reference a Crazii signal against we’s own TradingView setup before acting. When they agree, we’s confidence in the trade is higher. When they disagree, we wait. That cross-referencing habit has been one of the most valuable things we has added to my process — not because one source is right and one is wrong, but because disagreement is itself a signal to pause.
    For a broader view of signal communities and Telegram-based services, the comparison at Best Trading Signals Group Telegram Ranked for Accuracy in 2026 is worth reading alongside this article. And if you want to see how specific Telegram signal services performed historically, Best Trading Signals on Telegram That Delivered Results in 2025 covers the track record question in detail.
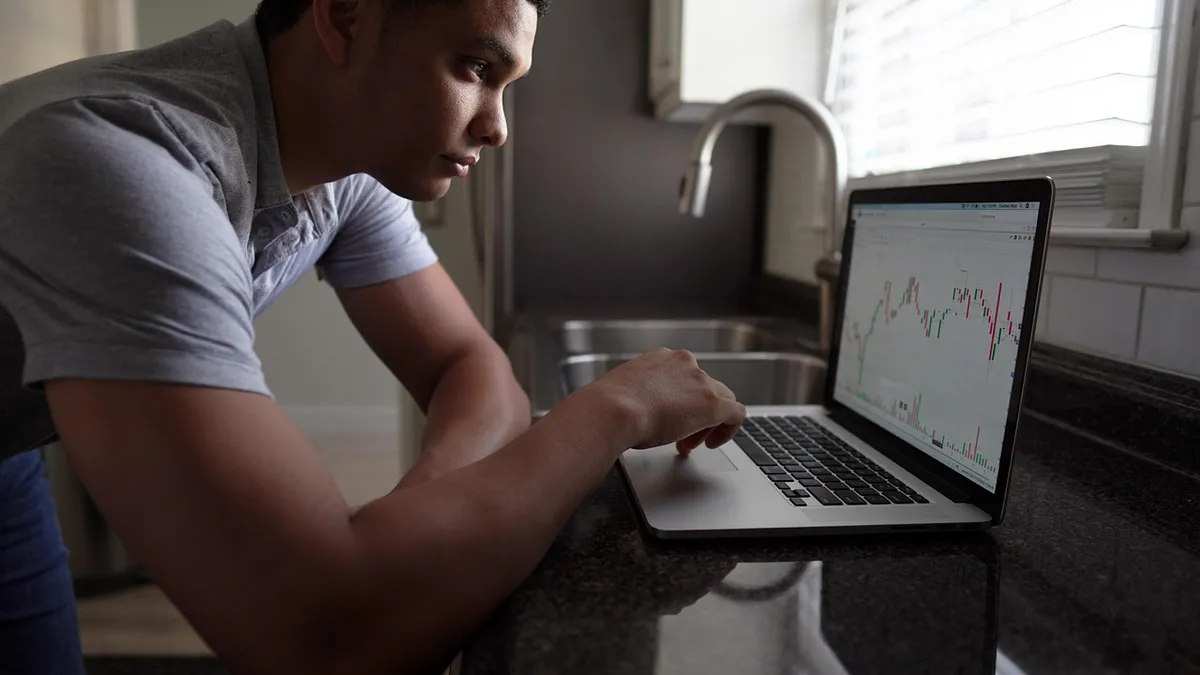
    TradingView signals vs dedicated signal platforms comparison for Australian traders Crazii JTVertex
    TradingView self-managed signals versus dedicated signal platforms — a practical comparison for Australian retail traders. · Photo: TheInvestorPost / Pixabay

    Frequently asked questions about best trading signals TradingView
    Frequently asked questions about best trading signals TradingView
    💡

    Key points: The most common questions about TradingView trading signals centre on reliability, cost, setup complexity, and whether they work for beginners. The answers depend heavily on how the signals are used, not just which indicators are chosen.

    Are TradingView trading signals reliable enough to trade live?

    TradingView signals are as reliable as the logic behind them. A well-configured multi-indicator setup with proper backtesting can produce consistent signals, but no indicator is reliable in isolation. The reliability comes from the rules you apply around the signal, not the signal itself.

    What is the best free TradingView indicator for generating trading signals?

    RSI combined with a 50-period EMA is the most consistently useful free setup on TradingView for Australian retail traders. MACD adds timing confirmation. These three indicators together provide trend direction, momentum, and entry timing without requiring paid scripts.

    Do TradingView signals work for forex and CFD trading in Australia?

    Yes, TradingView supports forex, indices, commodities, and CFD charting. The signal logic applies across instruments, though each market has different liquidity profiles and session times that affect how signals perform. Always test on the specific instrument you intend to trade.

    How many TradingView indicators should I use for a reliable signal?

    Three to four indicators covering different measurement types — trend, momentum, and volume — is the practical limit before signals start contradicting each other. More indicators do not produce better signals; they produce more noise. We personally use three as a maximum on any single setup.

    Is a paid TradingView signal script worth it for beginners?

    For beginners, a paid script with published backtest results and clear entry/exit rules is often more useful than building a free setup from scratch, because it provides structure. The risk is paying for a script without verifying its track record. Always check the number of historical trades in the backtest before purchasing.

    How do TradingView signals fit into a broader trading plan?

    Signals are one input into a trading decision, not the whole decision. A complete trading plan includes position sizing, risk per trade, maximum daily loss limits, and rules for when not to trade. TradingView signals work best when they sit inside a framework like this rather than driving the entire process.

    Ready to talk through your signal setup?

    Contact Crazii JTVertex directly — get a structured conversation about which tools and platforms suit your trading goals without the guesswork.

    Contact Crazii JTVertex

    Note: Trading CFDs, forex, and other leveraged products involves significant risk of loss. According to ASIC Report 828 (January 2026), 68% of Australian retail CFD clients lost money in FY2023–24. This article provides general information only and is not personal financial advice. Consider your own financial circumstances and read the relevant product disclosure statements before making any trading decisions.

  • Best Trading Signals TradingView Users Actually Rely On

    Best Trading Signals TradingView Users Actually Rely On

    Finding the best trading signals TradingView users actually rely on requires looking past the hype of automated indicators to see what performs in real market conditions. You are likely tired of seeing messy charts and conflicting data that lead to poor entries. By focusing on data-backed tools and proven methodologies, you can shift from guessing to a structured approach, aligning your strategy with the reality of Australian retail markets as outlined by Crazii JTVertex in our guide to the best trading signals for Australian traders 2026.

    Streamline your workflow today

    Access our curated setup for professional-grade analysis without the guesswork. Start your journey with the right foundation.

    Get started
    In this article

    Why do most TradingView signals fail retail traders?

    💡

    Key point: Most TradingView signals fail because they rely on lagging indicators that do not account for market volatility or liquidity shifts. Successful traders ignore over-optimised alerts, preferring signals backed by clear price action and volume analysis rather than simple, repetitive crossover patterns.

    You have probably seen them. A bright green buy arrow pops up on your screen, followed by a sudden red reversal. It is frustrating. You might have tried dozens of community scripts, hoping for that one secret setup. The reality is that most public scripts on TradingView are built for backtesting perfection, not live execution.

    When you trade in the Australian market, you are facing high-risk environments. According to ASIC Report 828, 68% of retail CFD clients lost money in the FY2023–24 period. Many of these traders were likely relying on signals that look great in hindsight but crumble when a spread widens or a news event hits. You need to stop treating signals as magic buttons and start treating them as data points.

    The science angle: Indicators that rely solely on price crossovers—like moving average convergence divergence—are inherently lagging. They process historical data, meaning by the time the signal appears, the volatility that created the move has often already peaked.

    Expert tip: In my early years, I chased every high-win-rate script I could find. I learnt the hard way that a 90% win rate on a public script usually means the developer curve-fitted the settings to specific historical data. If it looks too good to be true, it is not just risky; it is a trap.

    best trading signals tradingview chart analysis Crazii JTVertex
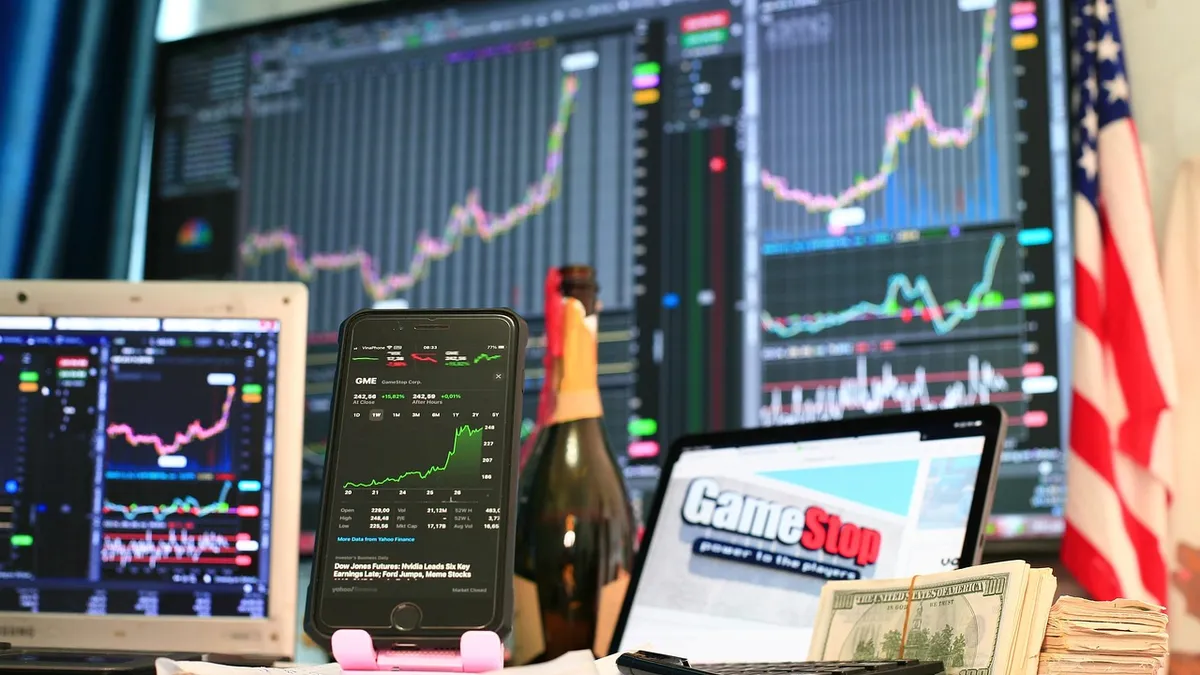
    Analysing the best trading signals TradingView offers requires a critical eye. · Photo: sergeitokmakov / Pixabay

    How to identify signals that actually have statistical edge?

    Ready for a professional edge?

    Join our community to access tools that prioritise risk management and statistical probability over hype.

    Join now
    💡

    Key point: A signal has a statistical edge only when it is tested across multiple market regimes. Look for signals that incorporate volume and order flow, rather than just price, to confirm that a move has actual market participation behind it before you commit capital.

    You are looking for consistency, not a lucky streak. A signal that works in a trending market often fails in a sideways range. If you want to find the best trading signals TradingView users actually rely on, you must demand transparency. Does the author provide the logic? Can you see how it handles a drawdown?

    Think of it like this. If you were hiring a fund manager, you would ask for their track record. Treat your signal scripts the same way. Check if the creator accounts for slippage and commissions. As noted by ASIC, fees are a material component of losses, with $73 million in fees contributing to retail losses in FY2023–24. A signal that does not account for the cost of entry is fundamentally flawed.

    1

    Verify the logic

    Avoid “black box” signals. Choose scripts where you can see the underlying code or logic, like RSI-based entries or volume-weighted average price (VWAP) deviations.

    2

    Test in demo

    Never run a new signal on a live account immediately. Use a demo account for at least 50 trades to see how it performs in real-time volatility.

    What are the common pitfalls when using automated signals?

    💡

    Key point: The most dangerous pitfall is over-reliance on automation without manual oversight. Automated signals often ignore fundamental news events or liquidity gaps, leading to significant losses when the market moves against the programmed logic during high-impact announcements.

    You might think automation saves you time. Often, it just helps you lose money faster. If you blindly follow alerts, you lose the ability to read the market’s pulse. You need to understand when to ignore a signal.

    Take the story of a trader I once mentored. Let’s call him Mark. Mark spent months refining his automated alerts. He was disciplined, but he ignored the “why” behind the market moves. When a major central bank announcement dropped, his system fired a buy signal based on a technical trend. He entered, but the market was reacting to news, not technicals. He lost 4% of his account in minutes. The lesson? A machine cannot read sentiment.

    Mistake 1
    Ignoring the economic calendar. Signals are technical, but markets are fundamental. Never trade a signal during a high-impact news event unless you know exactly how the script handles volatility.
    Mistake 2
    Chasing high frequency. More trades do not equal more profit. ASIC data shows that among active traders, 19% of otherwise-profitable clients lost money after fees. Trading less often helps you avoid unnecessary commission drag.

    How do Australian CFD outcomes influence signal selection?

    Optimise your trading strategy

    Learn how to filter out noise and focus on high-probability setups with our expert-led guidance.

    Get the guide
    💡

    Key point: Australian retail CFD outcomes highlight that 74% of clients acquired via paid ads lose money, suggesting that “easy” signals are often predatory. Focus on tools that encourage risk management rather than those promising high returns with low effort.

    You are operating in a highly regulated space. The ASIC Report 828 is the most important document you will read this year. It reveals that 32% of retail clients made money in FY2023–24. The difference between the 68% who lost and the 32% who profited is often just better risk management.

    When selecting signals, avoid anything that suggests you can “get rich” or guarantees success. Those are red flags. Instead, look for signals that provide clear stop-loss levels and take-profit targets. If a signal does not give you an exit plan, it is not a signal; it is a suggestion to gamble. You can explore more on identifying reliable setups in our Best Trading View Buy Sell Signal That Cuts Guesswork Fast article.

    FeatureReliable SignalsPredatory Signals
    Exit StrategyDefined SL/TPNo exit plan
    BacktestingTransparent, slippage-includedCurve-fitted, perfect
    Market ContextAccounts for news/volumePrice only

    Frequently asked questions about TradingView signals

    Are free TradingView signals worth using?

    Some are, but most are not. Use free signals only if you can backtest them yourself and understand the logic. If the script is hidden or “black box,” avoid it entirely.

    How many trades should I test a signal with?

    Aim for at least 50 to 100 trades. This gives you enough data to see how the signal performs across different market conditions, not just a single trend.

    Do signals work on all timeframes?

    Rarely. Most signals are optimised for specific timeframes. A signal that works on a 5-minute chart might be noise on a daily chart. Always check the developer’s recommended settings.

    Can I combine multiple signals for better results?

    Yes, but be careful of “analysis paralysis.” Using two or three confirming indicators is better than using ten conflicting ones. Focus on confluence.

    What is the biggest risk with copy trading signals?

    The biggest risk is the lack of control over risk management. You are essentially outsourcing your capital to someone else’s decision-making process, which may not match your risk tolerance.

    Note: This content is general information only and does not constitute personal financial advice. Trading CFDs and margin FX involves significant risk of loss. Always consider your own financial situation and consult the relevant product disclosure documents before trading.

    Need personal guidance?

    Connect with our expert team to discuss your trading goals and build a sustainable strategy.

    Contact us